Plot.py ‐ Drawing Trends and Trading lines
3rd part of the 5 part series on Plot.py. If you haven't read the previous part, please use the links below:
- Plot.py - Basic Usage
- Plot.py - Watchlists and Presets
- Plot.py - Drawing Trends and Trading lines
- Delivery Analysis - Using plot.py and dget.py
- Configuration
Plot.py provides mouse and keyboard interaction for drawing various trading lines. Matplotlib has its own mouse and keybinding.
To prevent conflict with existing keybindings, plot.py uses a draw mode, which enables the drawing features.
To toggle draw mode, press 'd'. When enabled, you are notified in the top right corner of the figure chart.
All instructions below assume you are in draw mode.
This mode works similar to TradingView and Zerodha charts. When a line is drawn it snaps to the nearest High, Low, Open or Close price.
The algorithm works as follows:
- Click anywhere above the candle high, snaps to the high point.
- Click anywhere below the candle low, snaps to the low point.
- Clicking between the high and low of the candle, will snap to closest open or close of the candle.
Magnet Mode is enabled by default. When disabled, the mouse click coordinates on chart is used to draw the line.
It can be disabled via user configuration.
Left mouse click above a candle high to draw a horizontal line at the high price of that candle. The line is drawn across the entire x-axis.
You can similarly draw lines at the low of the candle. See magnet mode for details. This is same as Horizontal line in TradingView.

Hold the control key and left mouse click any 2 points on the chart, to draw a segment. While holding the control key, click another point on the chart, to draw a new segment from the previous line ending to the new mouse click point.
You can draw a series of connecting lines while holding the control key and clicking various points on the chart.
Holding the control + shift key, left mouse click on the chart to fix the price level and a second click to mark the line ending. Repeat the mouse click sequence to draw more lines or release the control + shift key to complete.
First click marks the horizontal price level. Second click marks the line ending.
To draw a horizontal ray, extending to the end on the x-axis, release the control + shift after the first left mouse click. This is same as Horizontal ray in TradingView.

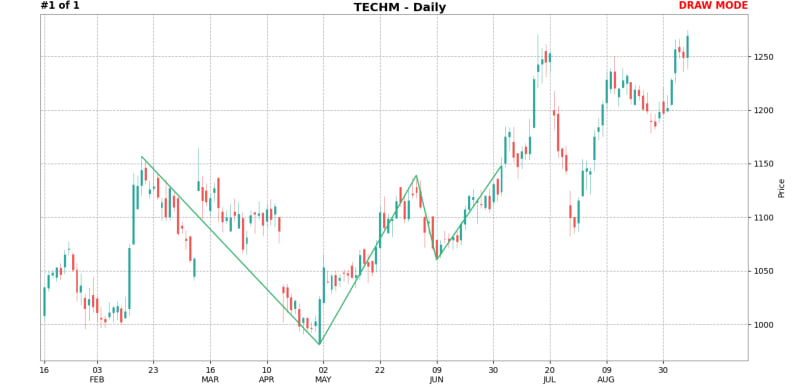
Hold the shift key and left mouse click any two points to draw a trend line. You can connect 2 lows or 2 highs for a uptrend or downtrend line.

To delete a single line, hover anywhere on the line and right mouse click to delete that line.
To delete all lines, hold the shift key and right mouse click. All lines on chart will be deleted.
Plot.py does not aim to replace professional charting packages. It provides a basic set of drawing features that should suit the needs of most investors and traders.
All chart drawings are saved to file and reloaded anytime the chart is loaded. These are saved in src/data/lines in python pickle format.
Chart drawings are specific to the timeframe. For example, drawings on weekly timeframe cannot be displayed on daily timeframe. This may change in the future.
In the next section, we will look at Delivery analysis