- Introduction
- Setup VMs
- Installation of Software
- Install and Configure Active Directory
- Brute Force Attack with Kali Linux
- Testing with Atomic Red Team
- Conclusion
In this project, we will set up an Active Directory environment to deepen our understanding of IT administration. We will also set up a Splunk instance to ingest events from both a Windows Server running Active Directory and a target Windows machine. Towards the end of the project, we will perform a brute force attack using a Kali Linux machine to observe the telemetry generated, and we will also use Atomic Red Team for additional testing.
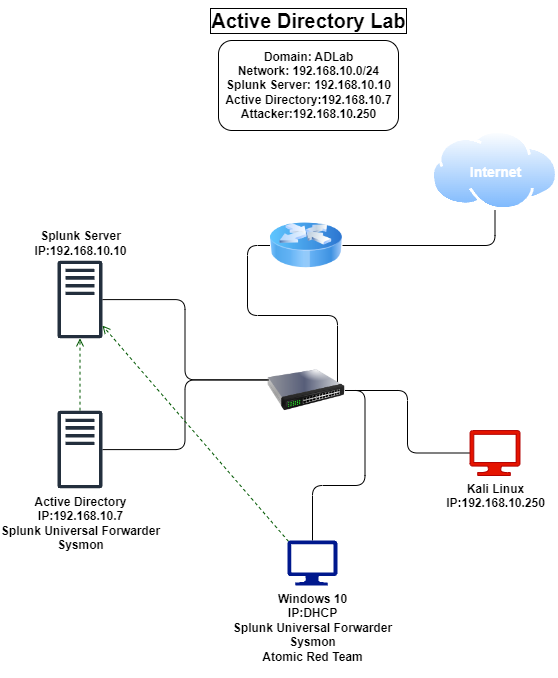
The diagram illustrates the network setup for our project:
- Windows Server: This server will run Active Directory.
- Windows 10 Machine: This will be the target machine for the Active Directory.
- Kali Linux Machine: This machine will be used to perform brute force attacks and other security testing.
- Splunk Server: This will be running on an Ubuntu server to collect and analyze logs and events from the Windows Server and Windows 10 machine.
- Network Infrastructure: Includes a router and a switch to connect all devices to the Internet and each other.
- Virtual Machine Provider: We will use VirtualBox.
- Assets:
- Windows Server
- Windows 10
- Kali Linux
- Splunk on Ubuntu Server
Since this is the first time we are using VirtualBox in our labs, I will explain the necessary steps and provide images to guide you through the process.
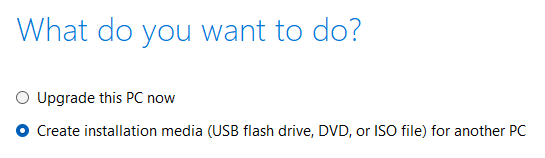
Select "Create installation media (USB flash drive, DVD, or ISO file) for another PC" and click "Next".
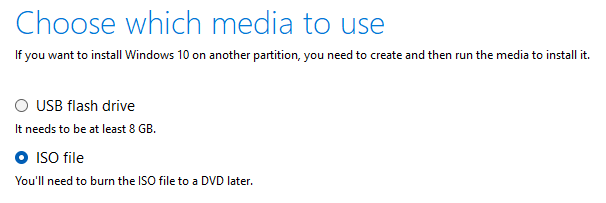
Select "ISO file" and click "Next". This will allow you to download the ISO file needed for installing Windows 10 on VirtualBox.
- Download and install VirtualBox from the official VirtualBox website.
- Once installed, open VirtualBox and click "New" to create a new virtual machine.
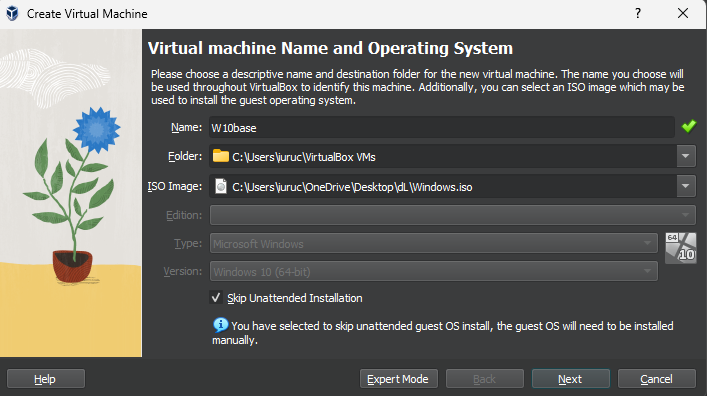
- Name: Give a name for your machine (e.g., "Windows 10 Lab").
- Folder: Select a folder where your VMs will be created.
- ISO Image: Select the ISO image you downloaded from the dropdown menu.
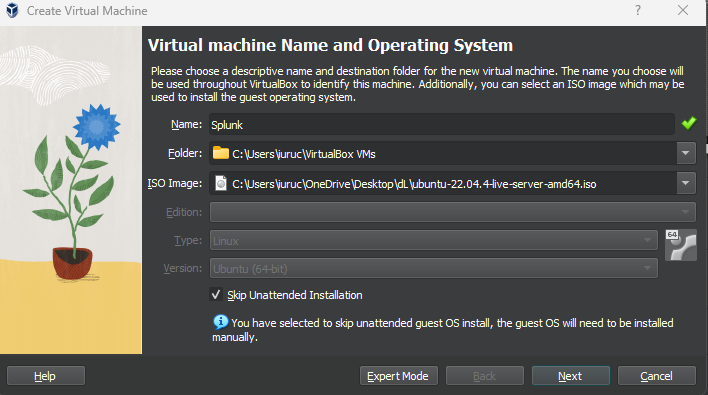
- Alternatively, you can select the "Skip unattended installation" button to install the OS manually later.
- Click "Next".
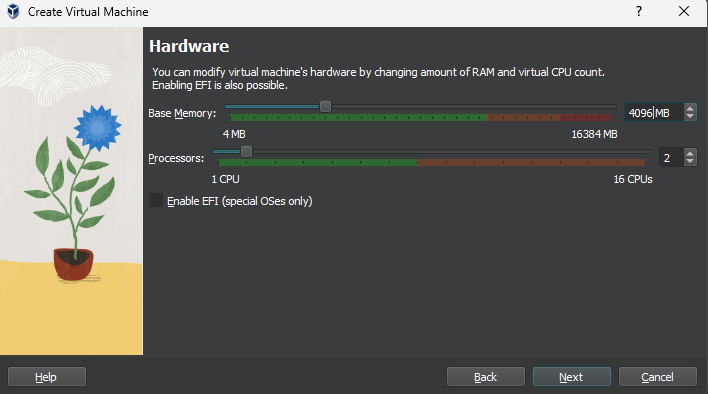
Hardware Properties:
- Memory: Allocate 4 GB of RAM (depending on your host computer's hardware).
- CPUs: Allocate 2 CPUs.
- Virtual Hard Disk: Leave it at 50 GB.
- Click "Next".
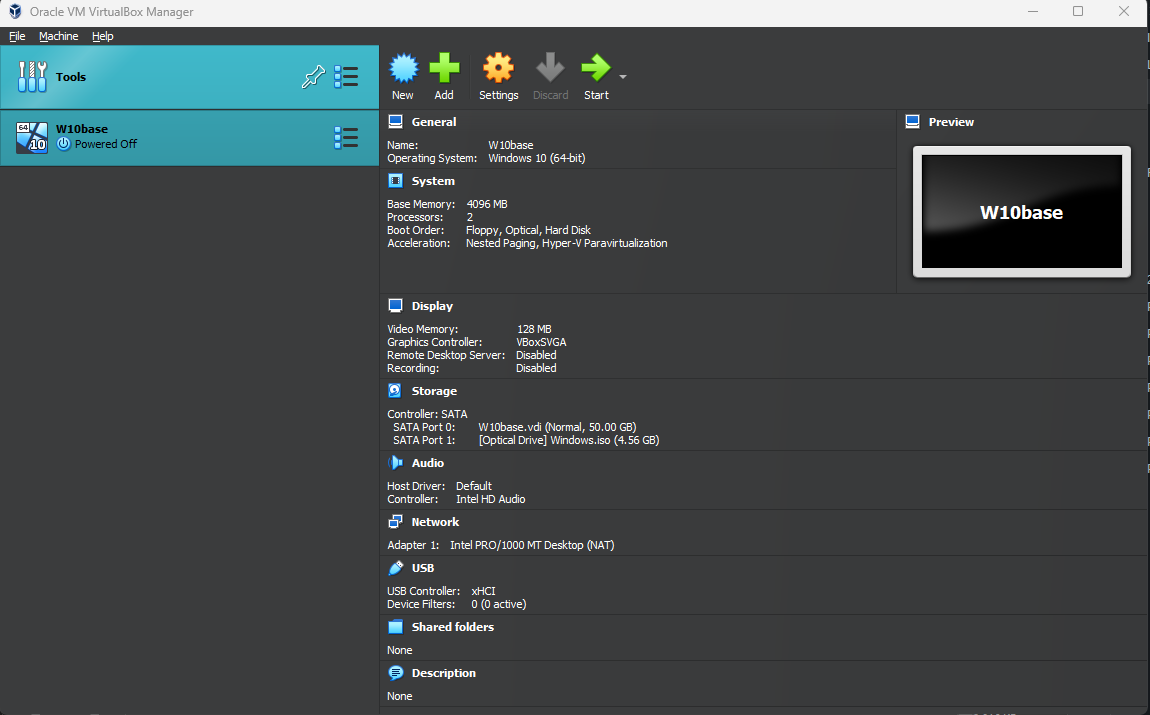
- Review the summary of properties. If everything looks good, click "Finish".
- Click "Start" to power up the virtual machine. It will directly proceed to the Windows installation.
- Follow the on-screen instructions to complete the Windows installation.
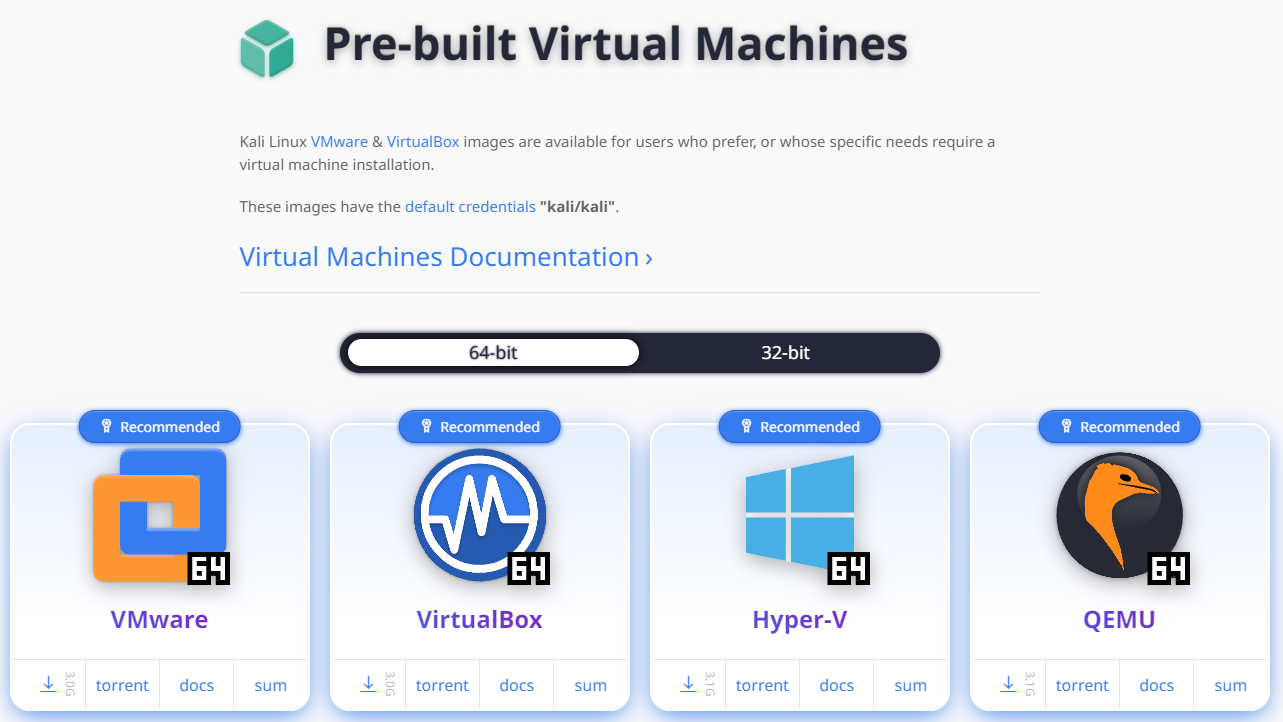
Next, we will install Kali Linux using a pre-built virtual machine image. Pre-built images are available for VMware, VirtualBox, Hyper-V, and QEMU. Here are the steps to set up Kali Linux in VirtualBox:
Pre-built Virtual Machines Kali Linux VMware & VirtualBox images are available for users who prefer or whose specific needs require a virtual machine installation. These images come with the default credentials "kali/kali".
After downloading the zip file, you will find two files in the directory. One of them is kali-linux-2024.2-virtualbox-amd64.vbox.
When we click this, it will automatically be imported into VirtualBox.
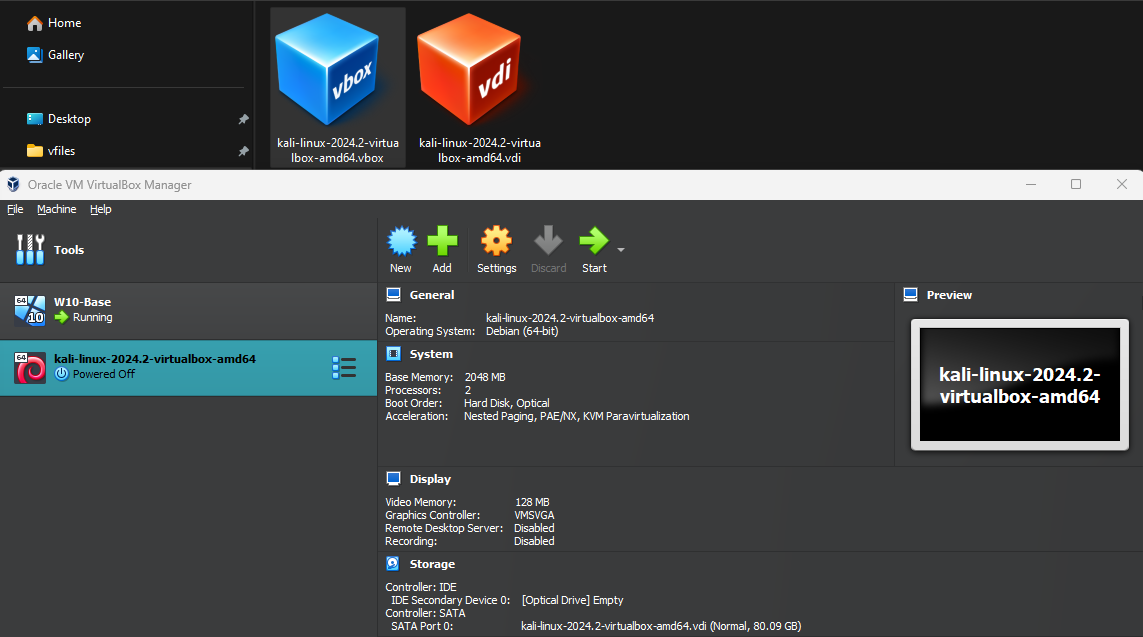
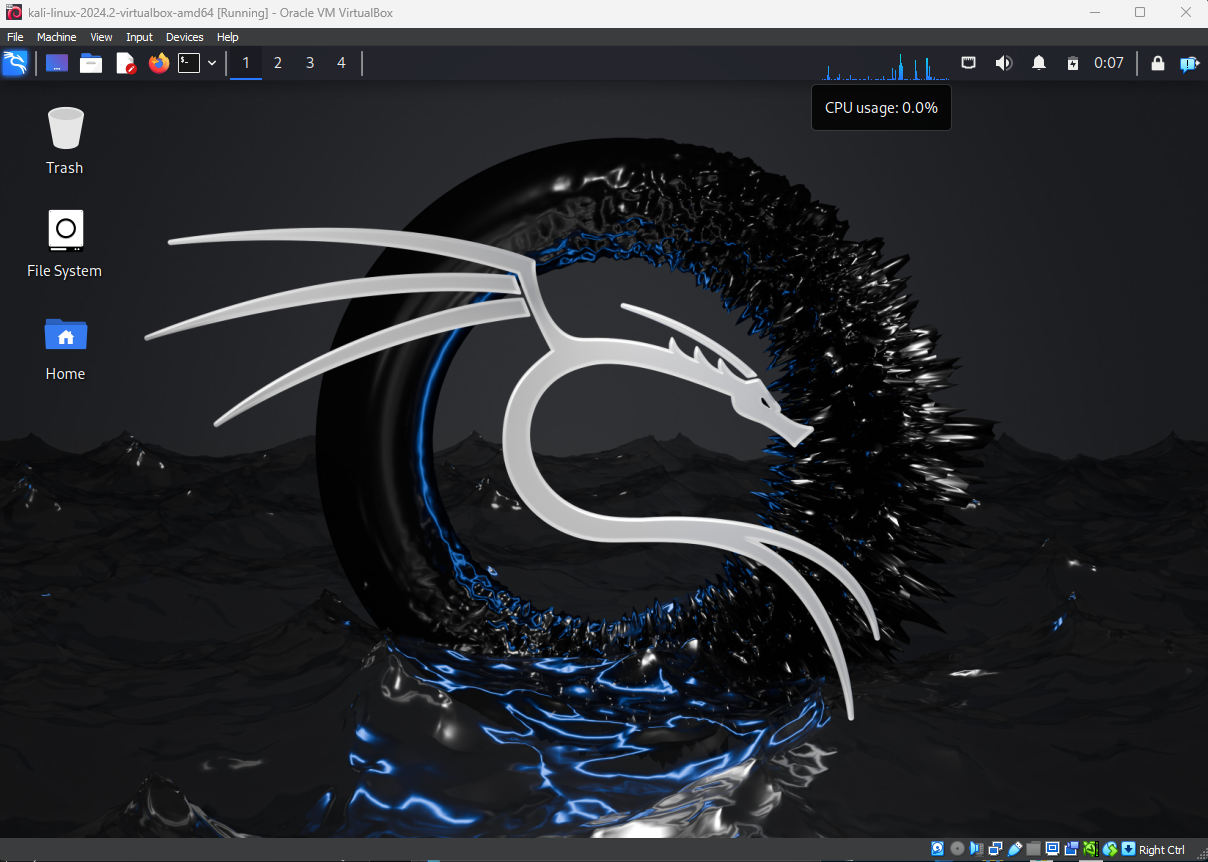
And just like that, our Kali Linux is ready.
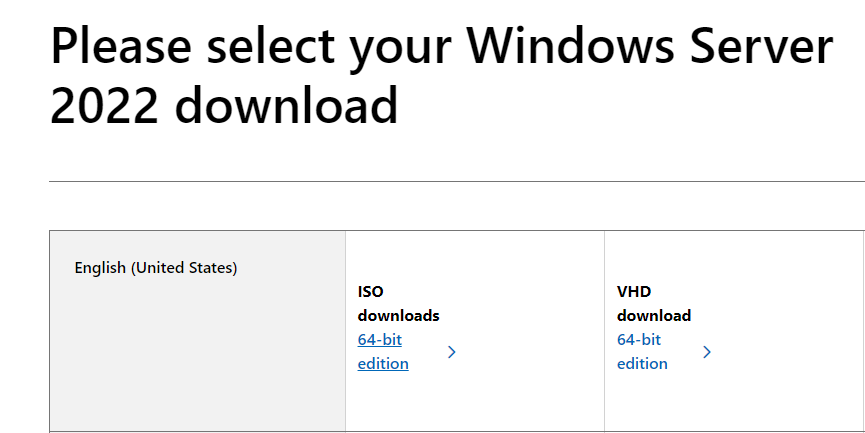
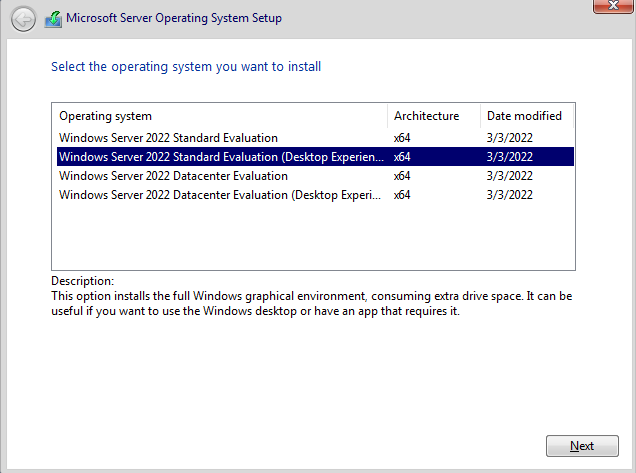
Next, we will install Windows Server. Go to https://www.microsoft.com/en-us/evalcenter/evaluate-windows-server-2022, fill in the information, and select the ISO edition - 64 bit.
After downloading the ISO file, create another machine on VirtualBox, the same as our Windows 10.
During the installation, make sure to select the second option: Desktop Experience.
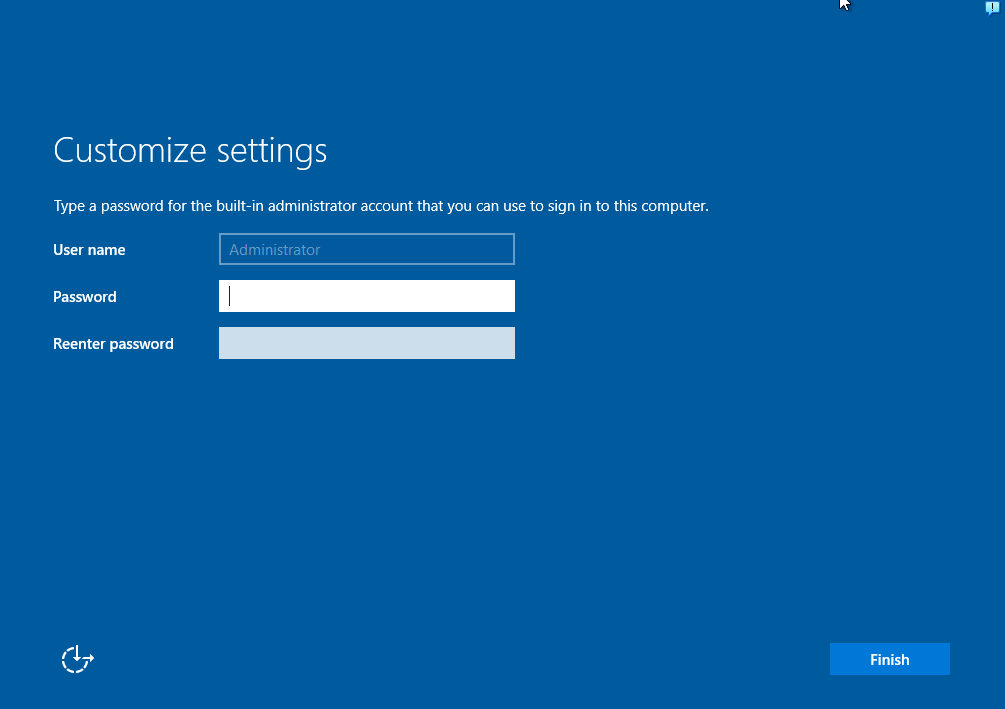
And then you will come to this page. Create a secure password and finish the installation.
To be able to log in, it will say that you need to press Ctrl + Alt + Del. Here, you will click the Input button from the top menu, and from there, you can click these combination keys. Or you can use Host + Del button. Usually, the Host key is Ctrl for Windows machines. We will continue with our server configuration later.
Lastly, we will install our Splunk server. Go to ubuntu.com and under the products, select Ubuntu Server. For the versions, we would like to install 22.04, since at the time of this project, Splunk supports 22.04. And same as before, we create another VirtualBox VM for Ubuntu/Splunk.
For the hardware, I will set the memory to 8 GB and Processors to 4. You may want to make the Splunk machine a little better in terms of hardware compared to other machines because this is going to be ingesting data and running searches on it. Set the hard disk to 100 GB and finish the installation.
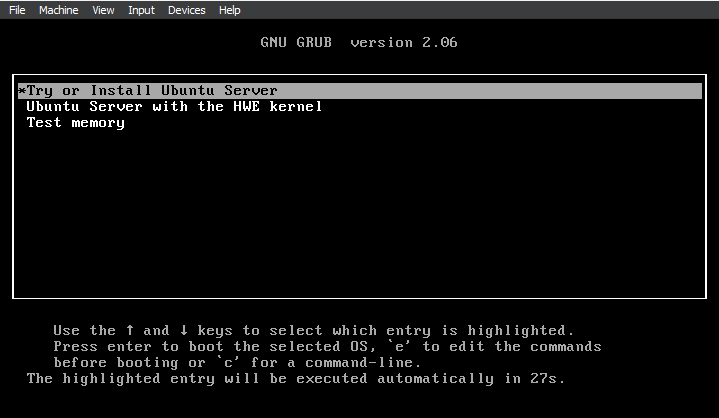
And when we start, we click the first option.
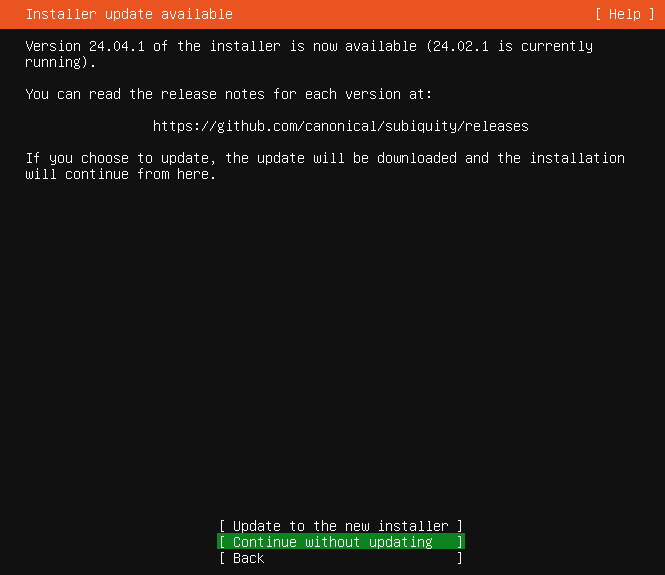
After this, it will ask us to select a language, and next, it will ask for an update. Select Continue without updating and continue.
After filling out this form, you can skip and continue every other page without adding any package, and the installation will start.
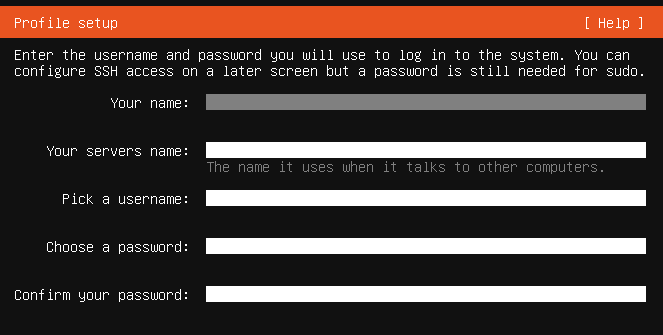
After the installation is complete, click the reboot button, and you will come to this page to enter the Splunk login and password.
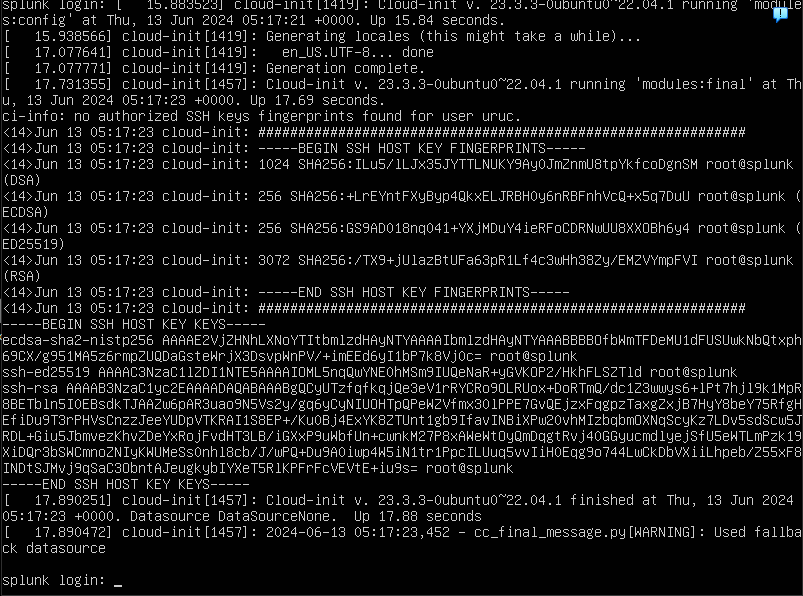
After entering the username and password, the first thing we will do is update our system:
sudo apt-get update && sudo apt-get upgrade -y
Our server is now ready to go for the Splunk installation.
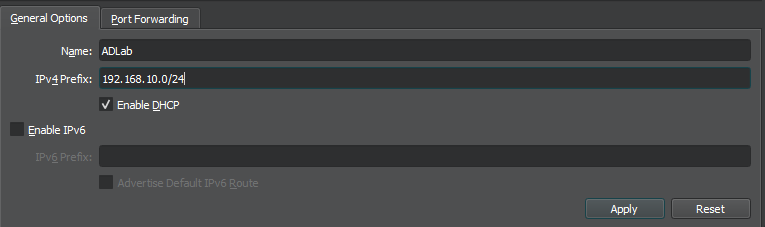
Before starting to install Splunk and Sysmon on the other VMs, we need to set up a NAT network on VirtualBox so our VMs can be on the same network and have internet access. On VirtualBox, go to Tools > Network and click NAT Networks from the menu. Then click Create. And for the properties, we are entering the name and IP address for the network that we decided on our diagram.
To connect our VMs to this network, we select the VM and then go to Settings > Network and select the "Attached to" option as "NAT Network". Then select the network name and click OK.
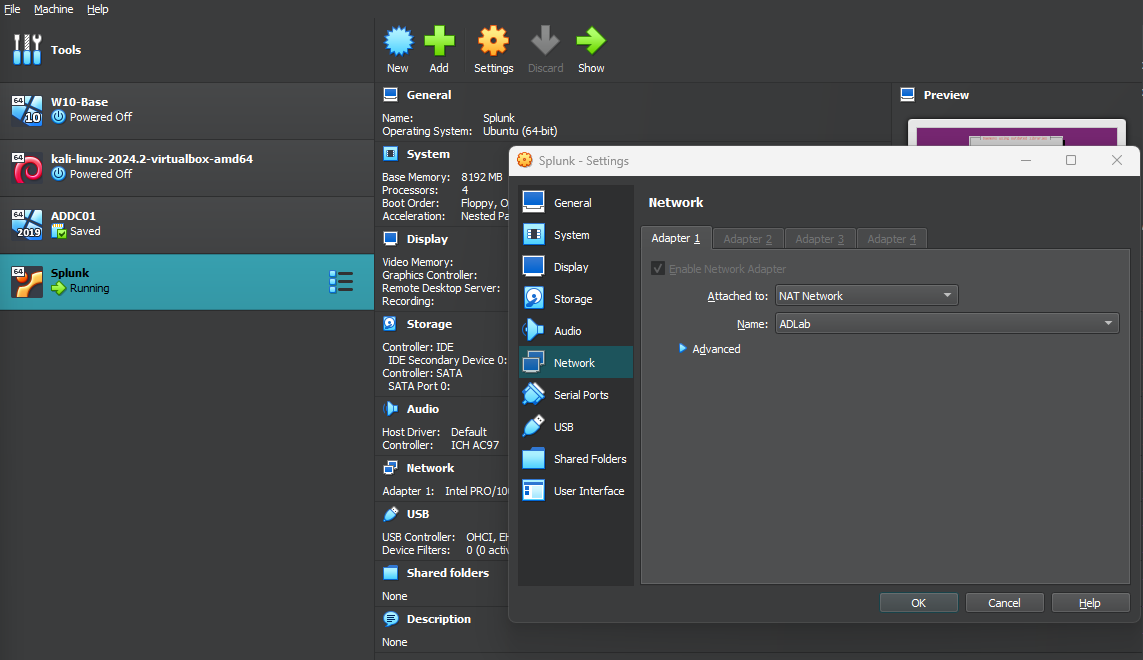
Do the same thing for the other VMs as well.
Now, on our diagram, we set that our Splunk server will have a static IP address of 192.168.10.10.
To set this:
sudo nano /etc/netplan/00-installer-config.yaml
And here we need to set everything like this, fill everything that is missing:
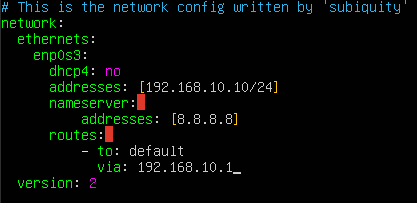
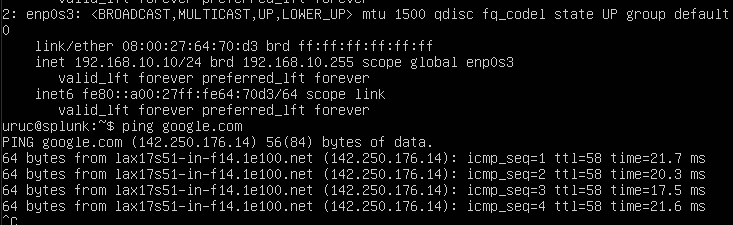
After saving and exiting with Ctrl + X and Enter, write sudo netplan apply, and after we check our IP with the command ip a and ping google.com to confirm we have the correct IP and also a connection.
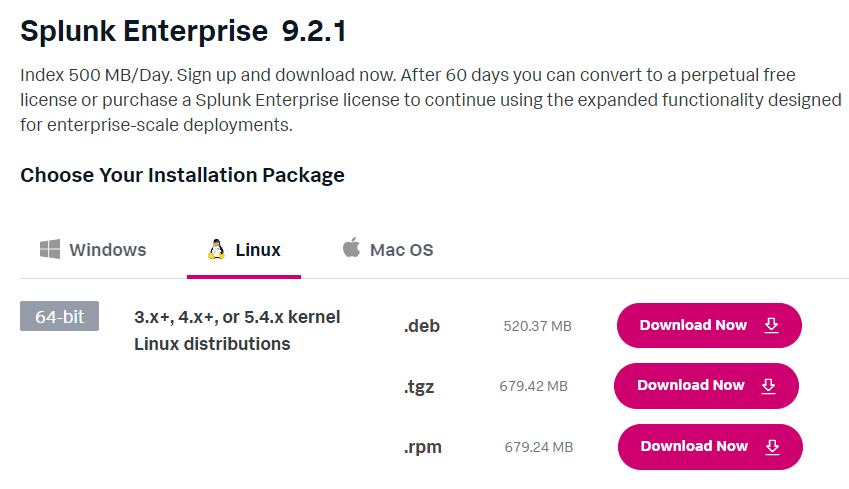
Now we can download and install Splunk. To do this, we will go to the Splunk website from our Host machine and register/log in. What we want is the .deb file of Splunk Enterprise.
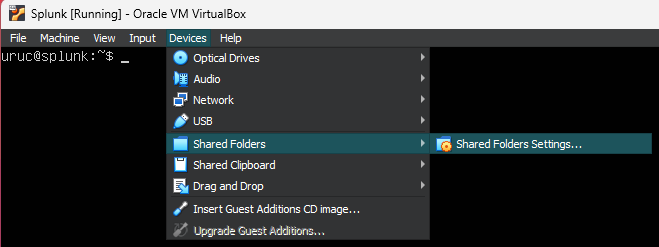
Next step is to install Guest Addons for VirtualBox.
sudo apt-get install virtualbox-guest-additions-iso
Then we click on the shared folder settings:
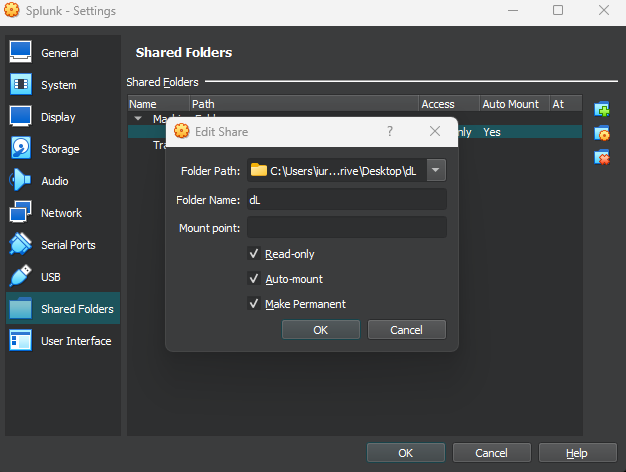
And click on the "Add a new shared folder" button. Here, the folder that we want to select is the one where the Splunk .deb installation file resides.
Select all options: Read-Only, Auto-mount, and Make-Permanent, and click OK.
And reboot the VM with sudo reboot.
Next, we want to add our user to the vboxsf group. To do this:
sudo adduser "yourusername" vboxsf
If you get an error saying the group does not exist, it means that we need to install another vbox utils.
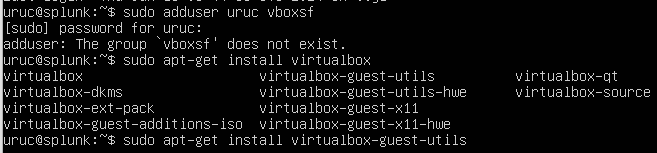
Install the virtualbox-guest-utils package as shown in the screenshot, and try again. It will work.
Next step is to create a new directory: mkdir share.
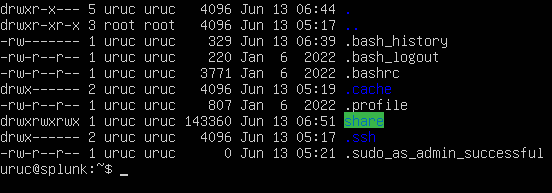
After creating the directory 'share', we want to run the following command to mount our shared folder on the directory called 'share':
sudo mount -t vboxsf -o uid=1000,gid=1000 dL share/
Important Note: Here, you will write the shared folder name that you selected from the settings. If you forgot, you can go to the menu on top to Shared Folder Settings and double-click on the path to see your shared folder name.
After this step, you will now be able to see the 'share' folder as highlighted.
Now you can go into this directory and run the installation command:
sudo dpkg -i splunk and tab to complete the Splunk file.
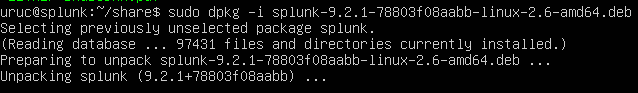
After the installation is complete, we go to the Splunk directory with cd /opt/splunk/.
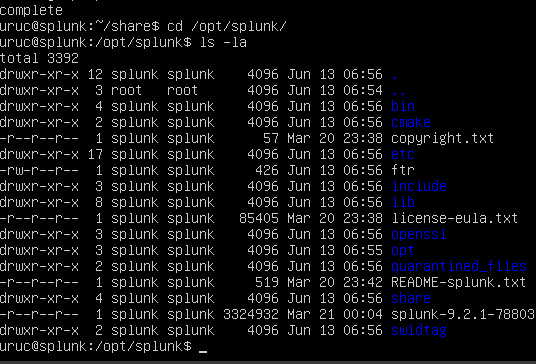
Now you'll notice that all of the user and group belong to Splunk, which is a good thing as it limits the permissions to that user. Let's change into the user Splunk by typing sudo -u splunk bash.
Now we are acting as the user splunk.
Change into the directory called 'bin' as the files listed here are all binaries that Splunk can use.
Here we run the command ./splunk start to run the installer.
Accepting the agreement and then creating a username and password, our installation will be completed.
The Splunk web interface is at http://splunk:8000 or http://"SplunkIPAddress":8000.
Let's run one more command to make sure that our Splunk starts up every time our virtual machine reboots.
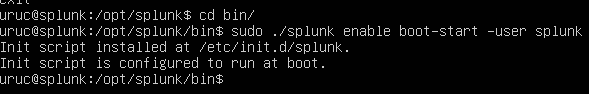
Type 'exit' to exit out of the user splunk first. Then go to the 'bin' directory again under the main user, whatever it is for you. And run:
sudo ./splunk enable boot-start -user splunk
This will make it so that anytime the VM reboots, Splunk will run with the user splunk.
Now that we have Splunk up and running, we want to install the Splunk Universal Forwarder and Sysmon on both our target machine and our server.
First, let's start with renaming our PC to Target-PC. After restarting our target PC, we first check our IP address.
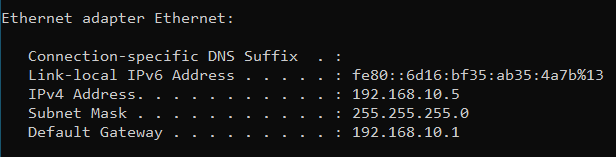
We do not have to change the IP address of the target machine since there is no IP conflict per our diagram.
Now let's open a browser window and try to connect to our Splunk server. Our Splunk IP address was 192.168.10.10, and we know that Splunk listens to port 8000:
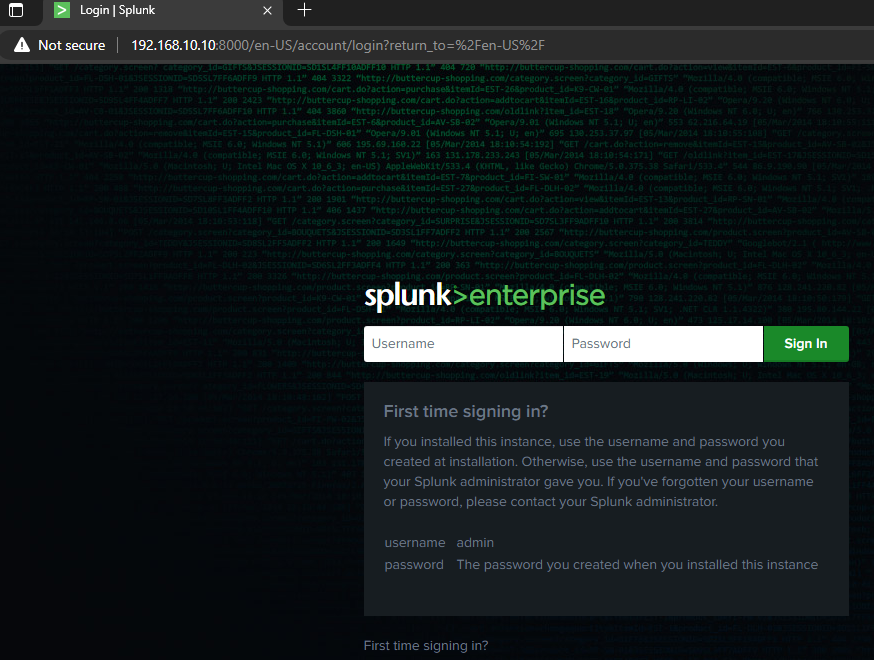
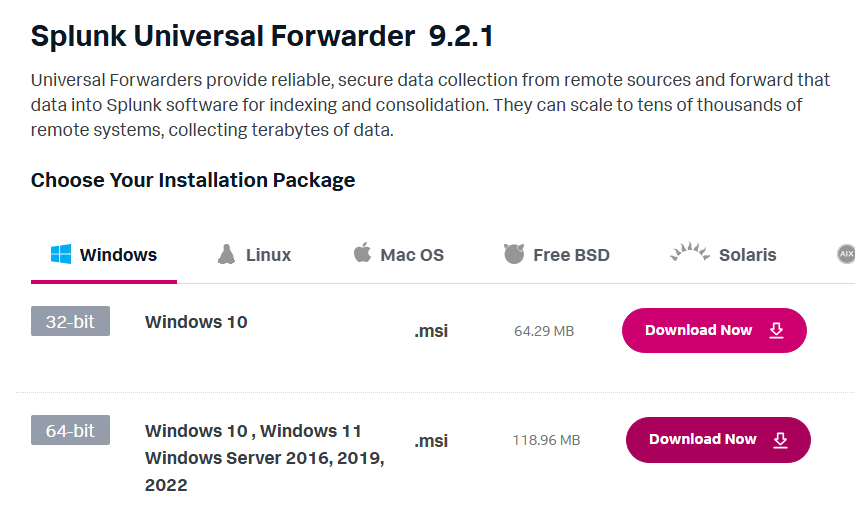
And as you can see, we can connect to its login page with no problem. Now let's install the Splunk Universal Forwarder on this machine so we can forward our logs to the Splunk server. Go to the Splunk website and log in with the account that you created. And download the Universal Forwarder for Windows.
After the download is complete, start the setup.
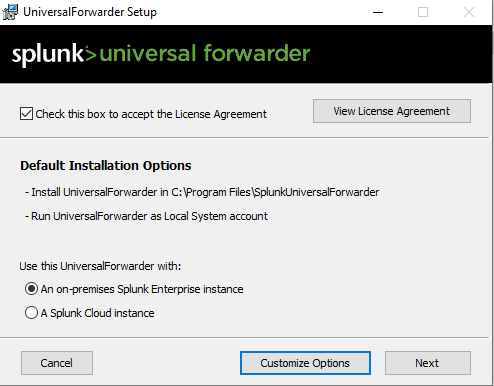
On the next page, for the username, you can put anything you like. I will put "Admin" and clicked the "Generate random password". On the next page, for the deployment server, just skip without entering anything because we don't have one.
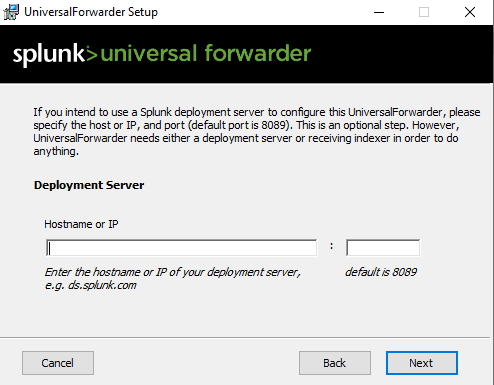
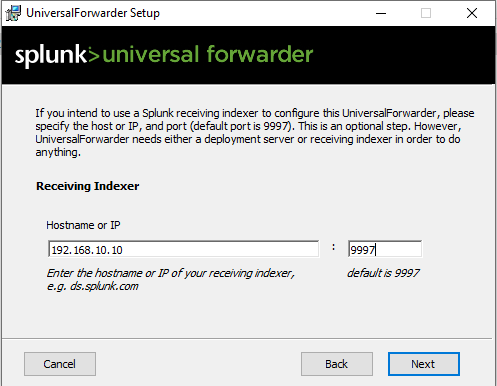
On the next page, which is the Indexer page, here we will enter our Splunk server's IP and put the port as 9997, which is the default port for the Splunk indexer. Then click "Next" and start the installation.
Meanwhile, we want to start downloading Sysmon, so go to the Sysmon - Sysinternals | Microsoft Learn and download Sysmon. The Sysmon configuration that we will be using is Olaf. So go to the GitHub - olafhartong/sysmon-modular: A repository of sysmon configuration modules
and download the sysmonconfig.xml file to the target machine.
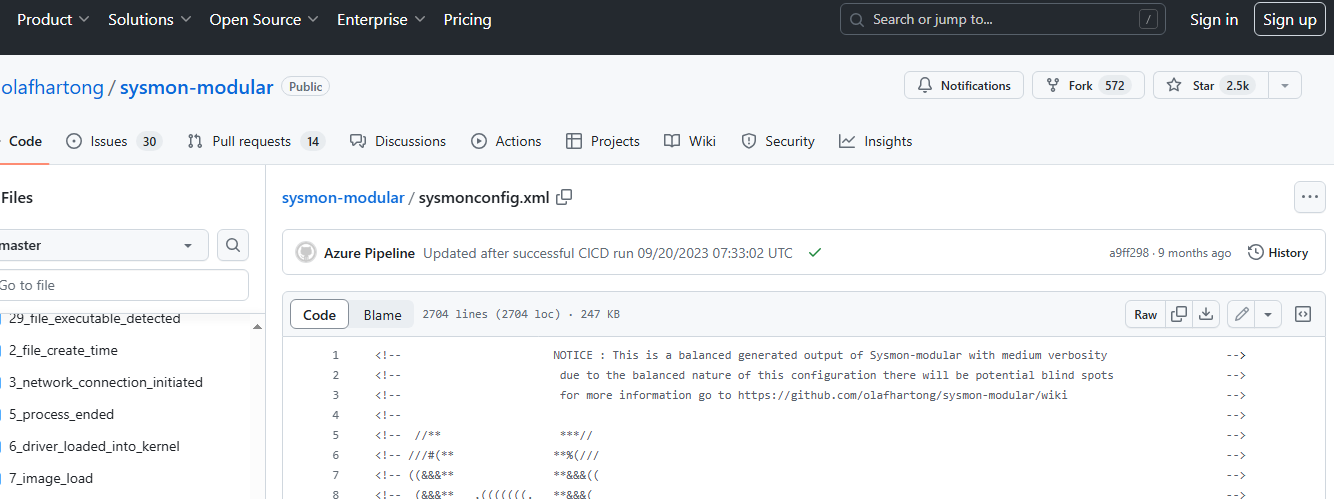
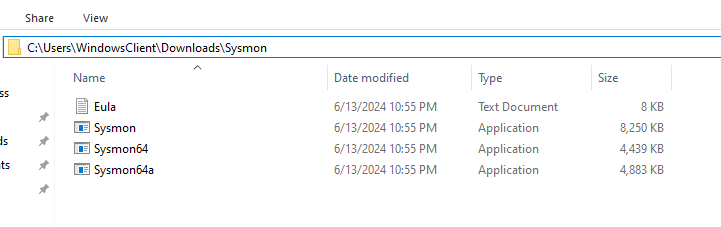
You can click "Raw" and right-click "Save as" and download the file. Next, go to the downloads directory and extract Sysmon from the zip file.
Open up a PowerShell in administrator mode and go to the location of this directory. You can copy the location from the menu bar and paste it into the PowerShell with the cd command.
To install Sysmon, run the command .\Sysmon64.exe -i with a configuration file. And since the config file that we installed is in the downloads folder, we can run this command:
.\Sysmon64.exe -i ..\sysmonconfig.xml
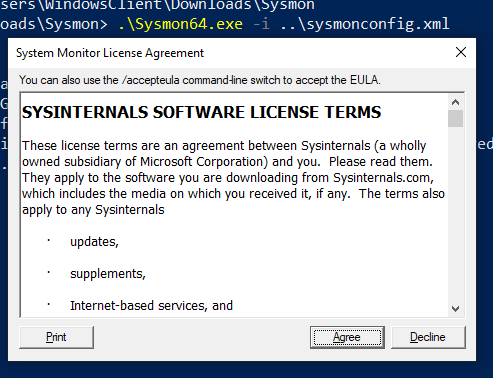
And Sysmon will be installed shortly. And meanwhile, our Splunk Universal Forwarder is also installed.
Now is the most important part. We need to instruct our Splunk Forwarder on what we want to send over to our Splunk server. To do this, we must configure a file called input.conf. This file is located at
C:\Program Files\SplunkUniversalForwarder\etc\system\default
But we will not edit the input.conf file under the default directory because the configs in this directory are there just in case we mess anything up, so we will create a new file under the local directory.
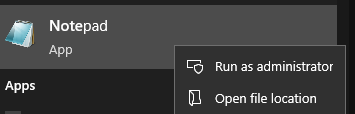
Now, to be able to create a new file in the local directory, we need to be an administrator. So to do this, we will search for Notepad from the search bar and open it as an administrator.
Now, this is the content from the input.conf file that I copied here:
[WinEventLog://Application]
index = endpoint
disabled = false

[WinEventLog://Security]
index = endpoint
disabled = false

[WinEventLog://System]
index = endpoint
disabled = false

[WinEventLog://Microsoft-Windows-Sysmon/Operational]
index = endpoint
disabled = false
renderXml = true
source = XmlWinEventLog:Microsoft-Windows-Sysmon/Operational
You can copy and paste this into the new Notepad that you opened. This is instructing our Splunk Forwarder to push events related to the application, security, system, and also Sysmon to our Splunk server.
Important note: See that the index that we are pointing to is index = endpoint. This is important because whatever events fall under these categories will be sent over to Splunk and placed under the index "endpoint". If our Splunk server does not have an index named "endpoint", it will not receive any of these events.
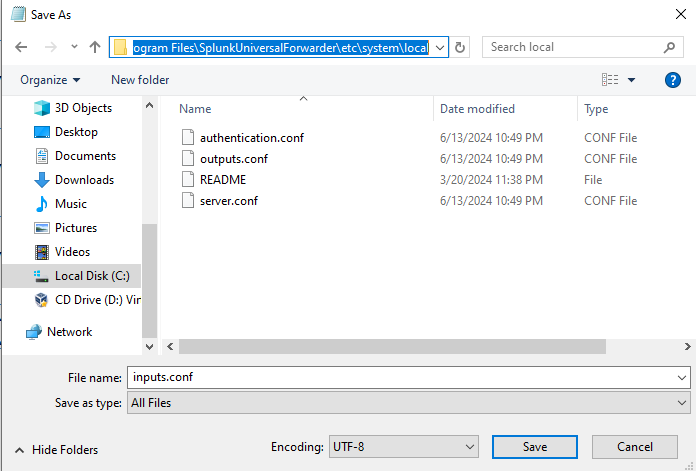
After filling in the config file, save it under the local directory as we mentioned before as inputs.conf.
C:\Program Files\SplunkUniversalForwarder\etc\system\local
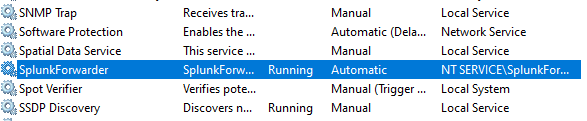
Do note that anytime you update the inputs.conf file, you must restart the Splunk Universal Forwarder service. To do this, we open the Services as an administrator and find the "SplunkForwarder".
Another important note: If we see that the "Log on as" line is "NT SERVICE":
Go on and double-click it, and look at the "Log On" tab from the menu:
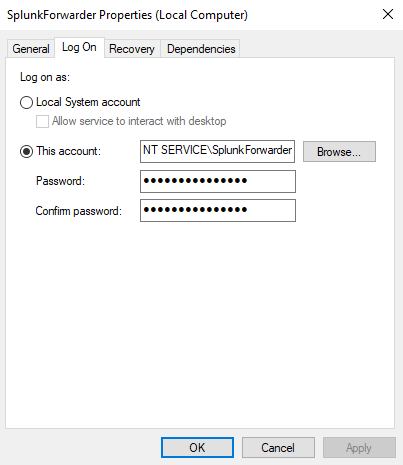
If you see that it is using "This account" and it is "NT SERVICE\SplunkForwarder", it might not be able to collect some of the logs due to some of the permissions. So you want to select "Local System account" and hit "Apply".
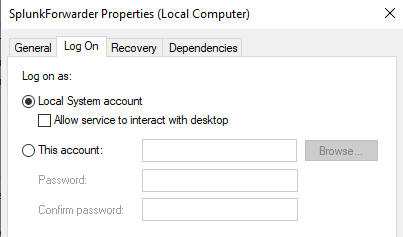
Which then will ask us to stop and restart the service, and we will do so. Just double-check on the Services menu that SplunkForwarder is "Log on as" Local System and also that Sysmon64 is running.
After finishing these steps, we can finalize our Splunk server configuration. Head over to http://192.168.10.10:8000/ and log in with the credentials that we set during the Splunk server installation.
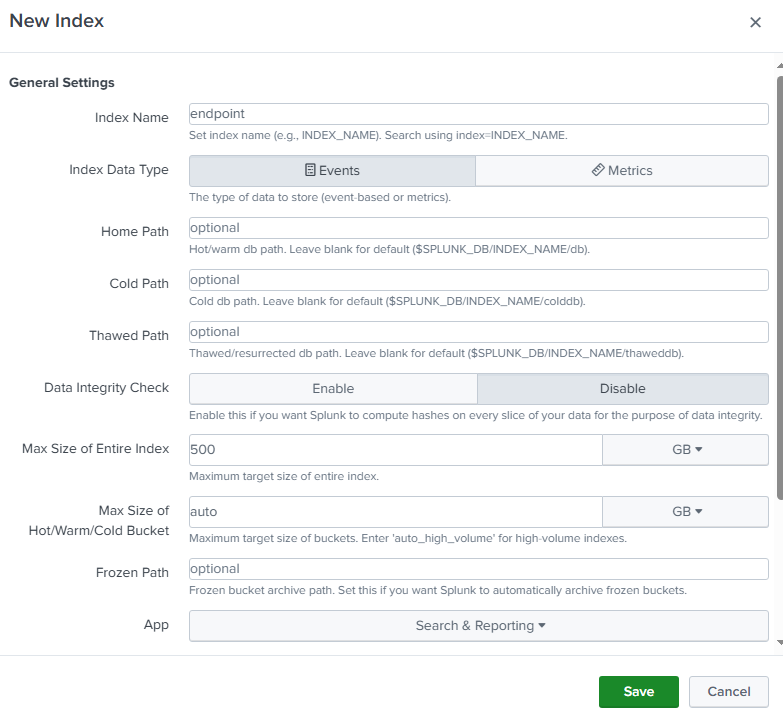
On the menu, we want to go to the Indexes from the Settings menu. Now recall that our index name was "endpoint" from the Splunk Universal Forwarder inputs.conf file. We now will create this index. Just click on the "New Index" button from the top right and enter the name "endpoint" and save.
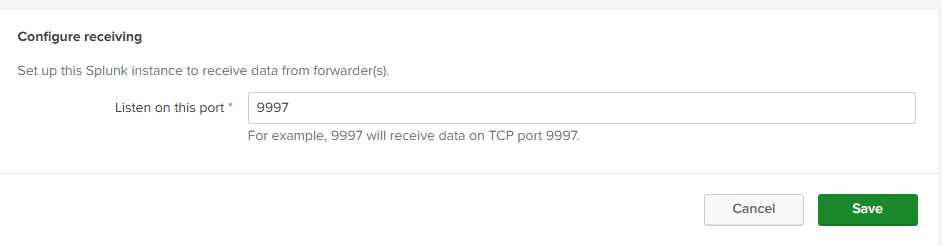
Now you will be able to see the "endpoint" index on the list. Next, we need to make sure that we enable our Splunk server to receive the data. In order to do that, go to Settings > Forwarding and receiving and under the "Receive data", click on the Configure receiving button, and there click on the New Receiving Port on the top right, and recall that during the setup, we mentioned that the default port is 9997, enter it and hit save.
Now at this point, if we set up everything correctly, we should start seeing data coming in from our target machine. Click on the Apps from the top left corner, and select Search & Reporting.
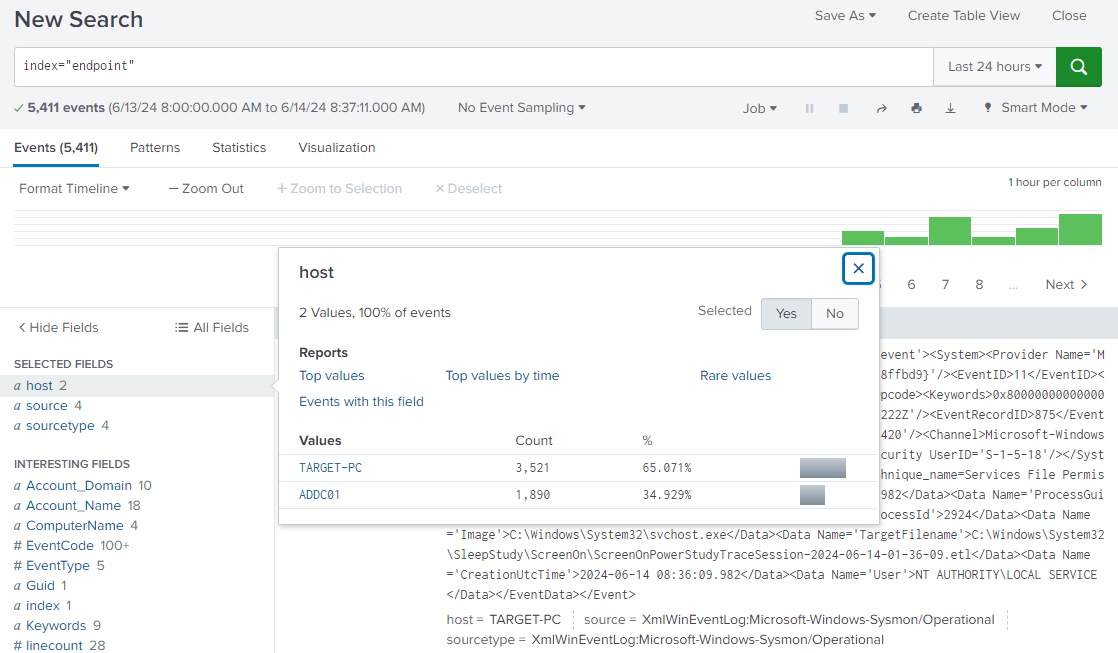
And here on the search bar, write index="endpoint" and click enter.
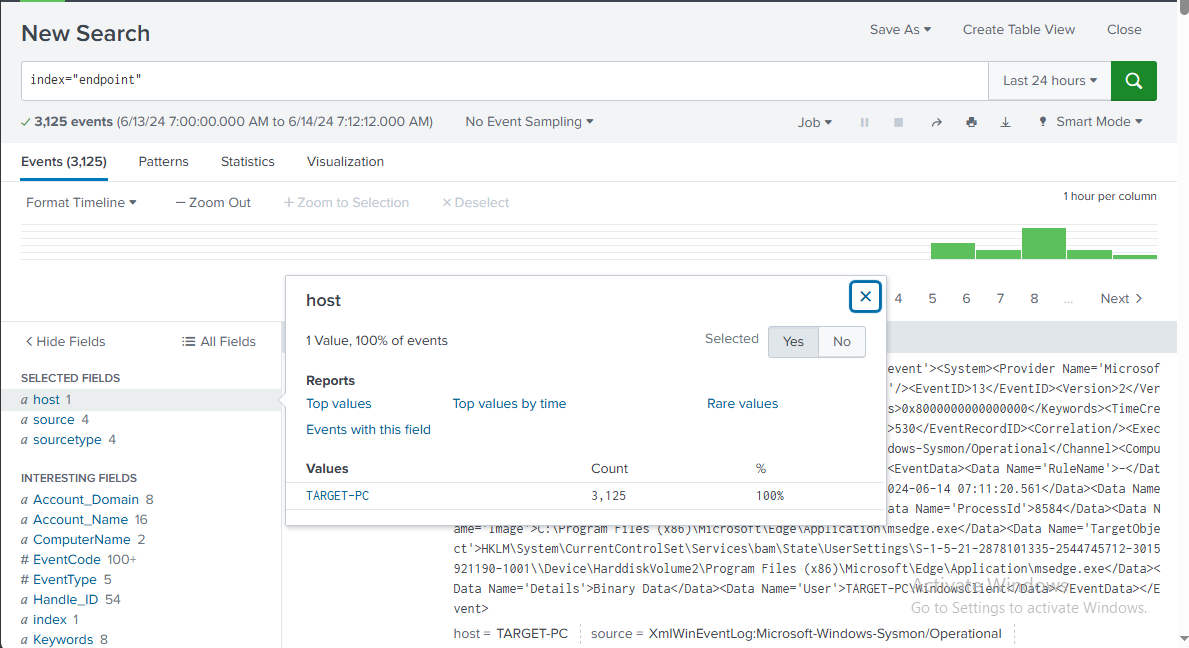
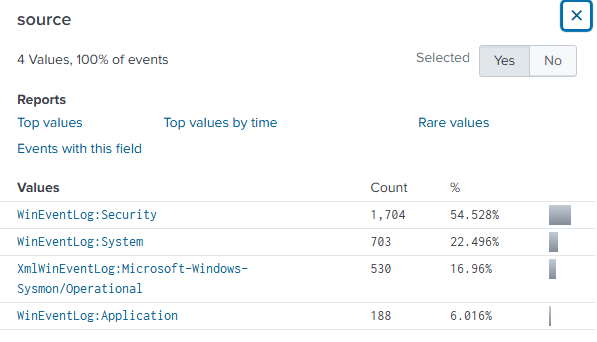
And we do see some events, and if we scroll down a little bit and see the "host" field from the left, we see that it is TARGET-PC. We also see some sources and sourcetypes, which is exactly what we entered in our input.conf file on the Target-PC.
Now it is time to do this same setup on our Active Directory (Windows Server). Also, change the name of the Windows Server machine to ADDC01. And change the IP address of the machine to the value on the diagram.
Other than that, everything is the same as with the Target-PC, so I will not show this part here.
And after if everything is successful, you should be seeing 2 hosts like this when you search for index=endpoint.
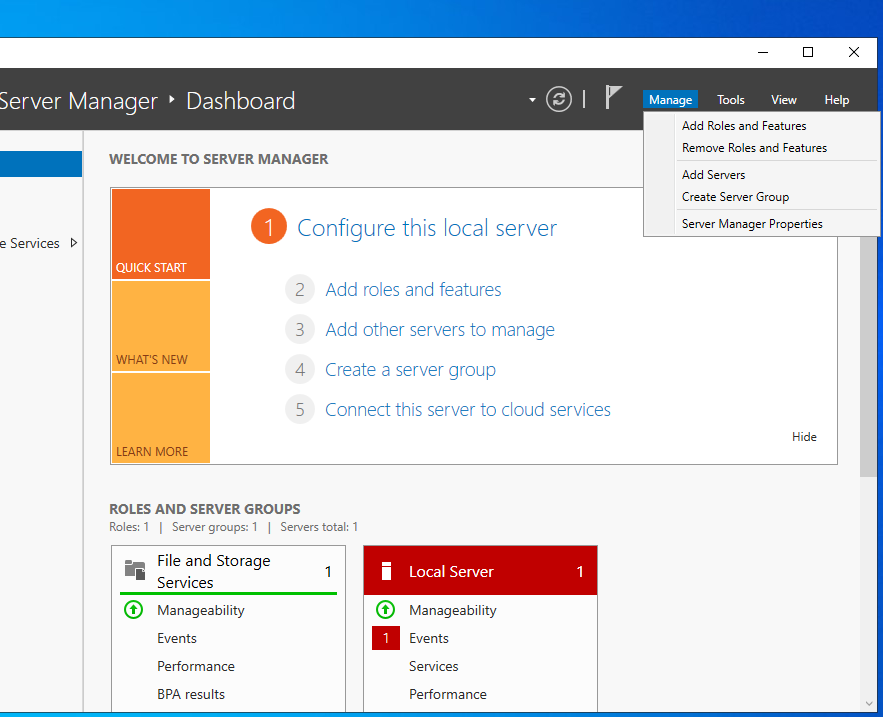
Now it is time to configure our Active Directory and then promote it to a Domain Controller. And then we will be configuring the target machine to join this domain. Double-check the IP address of the Windows Server, and then open Server Manager and on the top right go to Manager > Add Roles and Features.
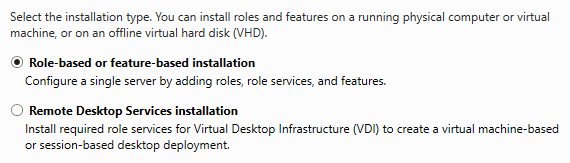
Click "Next" and on the next page, select "Role-based or feature-based installation".
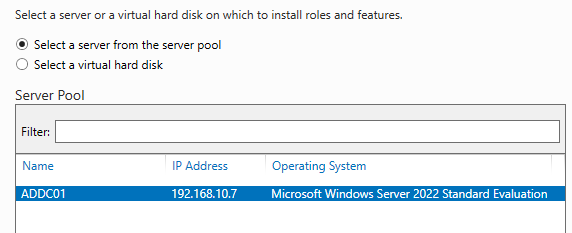
Next, you will select the server from the list, since we only have one server, there will be only one on the list, and we select and go "Next".
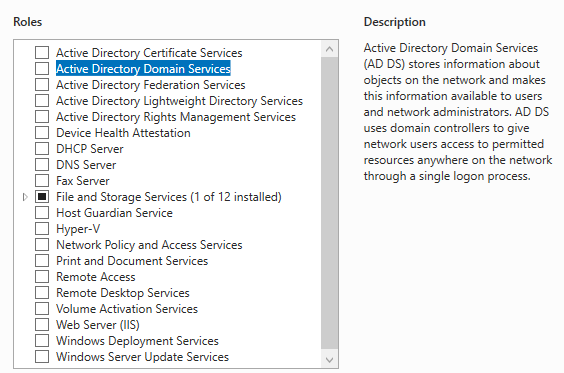
On the next page, we will set the Server Roles. Here we want to select the Active Directory Domain Services.
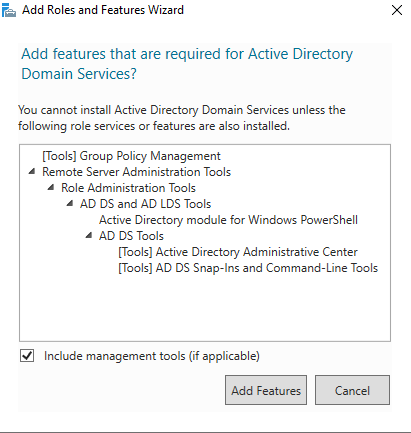
Click on the "Add Features" on the pop-up page and go "Next".
From this point, click on "Next" until you get to the "Install" step, and start installing.
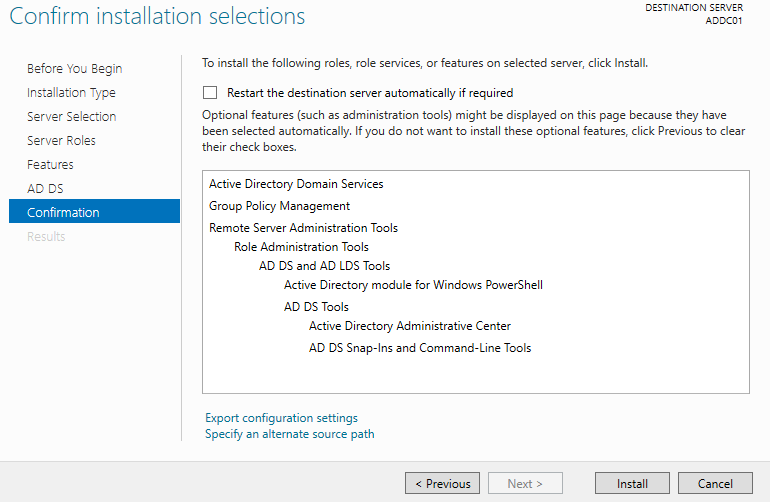
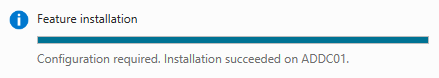
Click on "Close" when you see this "Installation succeeded" message.
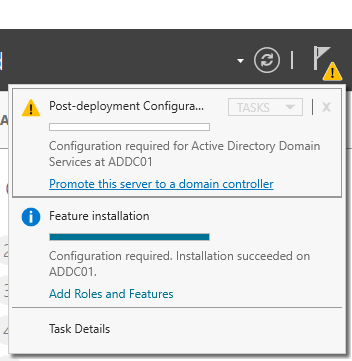
On the top right, click on the Flag with the yellow sign and click on "Promote this server to a domain controller".
And next, select the "Add a new forest" option because we are creating a brand new domain.
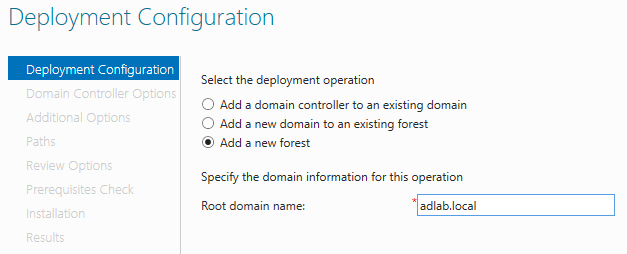
Now, as a domain name, I will call it "adlab.local". The domain name must have a top-level domain, so in other words, the domain name cannot be just "adlab", it must be "adlab.something". On the next page, leave everything as it is and create a password, and from this point, just click "Next" for the upcoming pages.
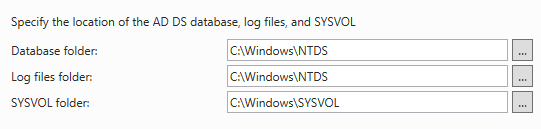
Quick note for this page: These are the paths used to store our database file named "NTDS.dit", and for your information, attackers love to target domain controllers, not only because it has access to everything but also because of this file as it contains everything related to Active Directory, including password hashes. If you do notice any unauthorized activity towards this file, you can assume that your entire domain is unfortunately compromised. Click "Next" a couple more times, and after all prerequisite checks have passed, click on "Install".
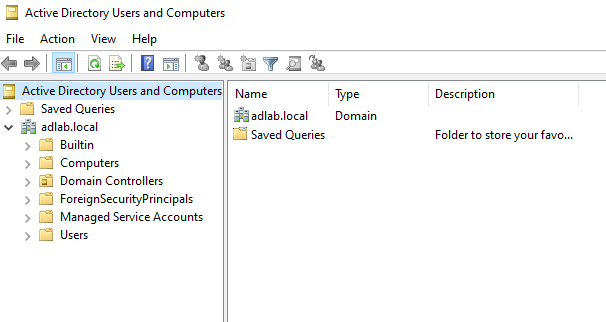
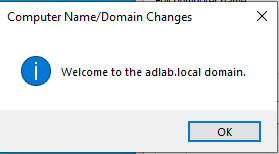
Once the setup is completed, the server will automatically restart. And we will see our domain followed by a backslash, which indicates that we successfully installed ADDS and promoted our server to a domain controller. Next step is to start creating some users, so let's log in and do just that.
On our server manager, we want to click on the Tools at the top right corner and select Active Directory Users and Computers.
And if we click on the "Builtin", we see all of the groups listed on the right side. These groups have all been automatically created by the AD, and we can double-click any of these and read the description.
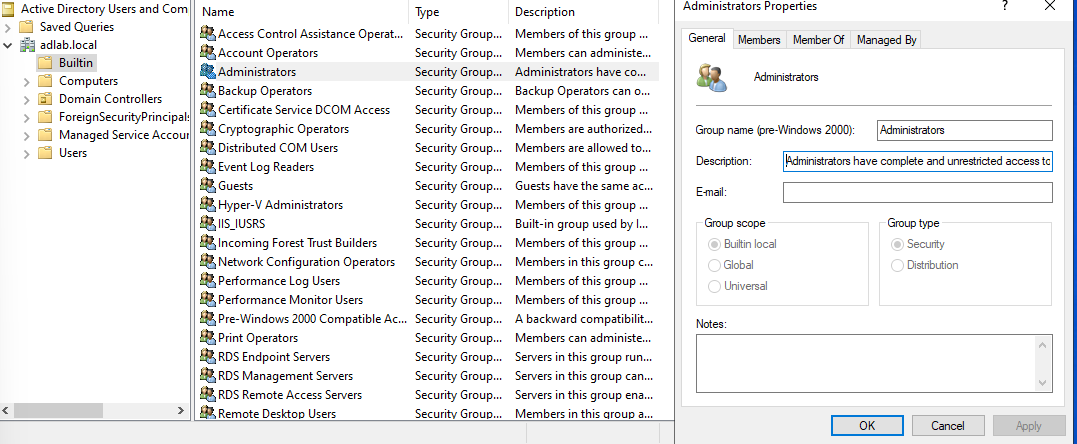
And under the "Members" tab, we will see who is assigned to this group, and under the "Member Of" tab, we will see what groups this group is in. Note: You cannot add additional groups within a built-in group, but you can create a custom group and add that built-in group to that custom group.
Now if we click on the "Users" folder, we see different users and groups in here. You can right-click and create a group or user here, but in a real-world environment, it is likely broken up into different departments, AKA organizational units, for example, HR, Finance, IT, Sales...
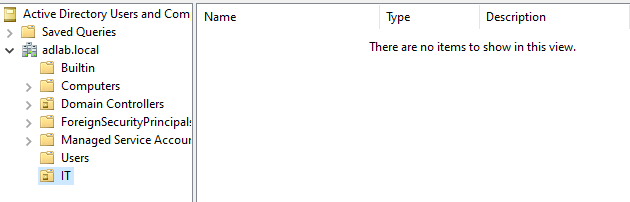
To mimic this, we can right-click on the domain and go under New > Organizational Unit and name it, for example, "IT", and click OK, and now you have a new organizational unit created.
Under this "IT" organizational unit, right-click and create a new user, and put a name and username:
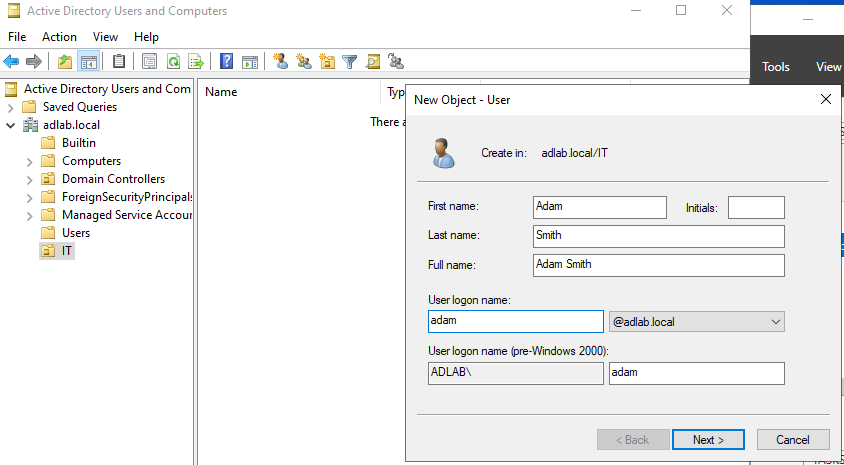
Click "Next" and create a password, and finish.
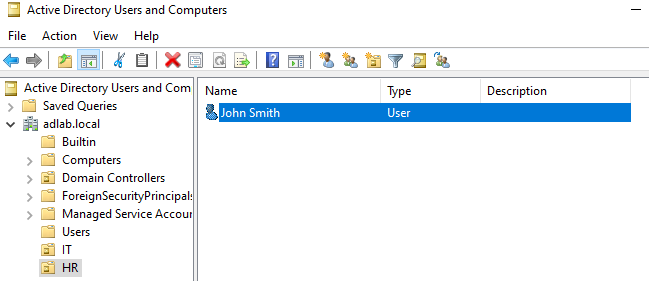
And let's create another organizational unit and create another user under it.
There are many scripts out there that can help auto-create users, groups, and computers, but for this project, it is not necessary.
Now that we have our ADDC, we will now head over to our Windows Target-PC and join it to our newly created domain called "adlab.local" and authenticate using the "Adam Smith" account.
Power up our Windows 10 machine and search for PC > Properties > Advanced system settings.
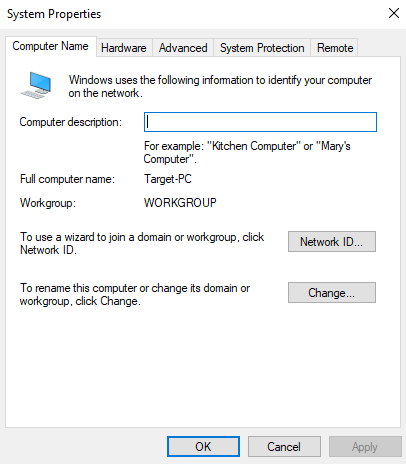
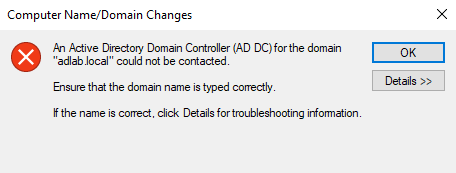
Under the "Computer Name" tab, click "Change" and select "Member of Domain", and write our domain name "adlab.local".
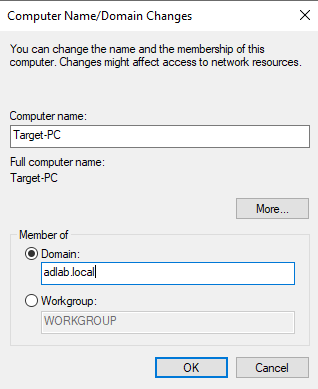
When we click OK, we might get an error saying the domain could not be contacted. This is because the machine does not know how to resolve our domain, "adlab.local", and this is how DNS works.
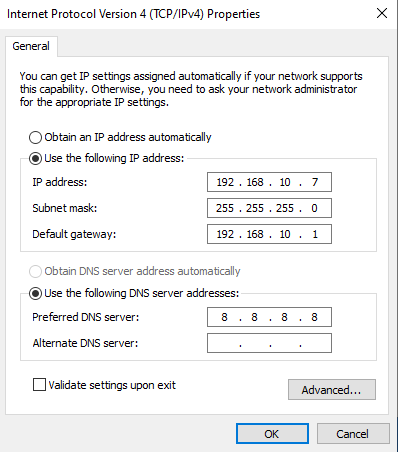
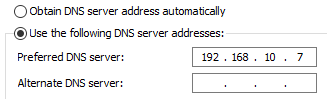
To fix this, go to the network adapter > change adapter options > select the adapter and right-click and go to properties and change the DNS server to our ADDC IP.
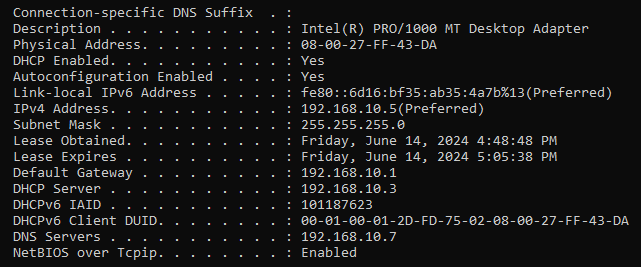
And to check the configuration is set, open a command prompt and run ipconfig /all.
Now let's try again to join our domain. And now we are prompted to log in with some credentials.
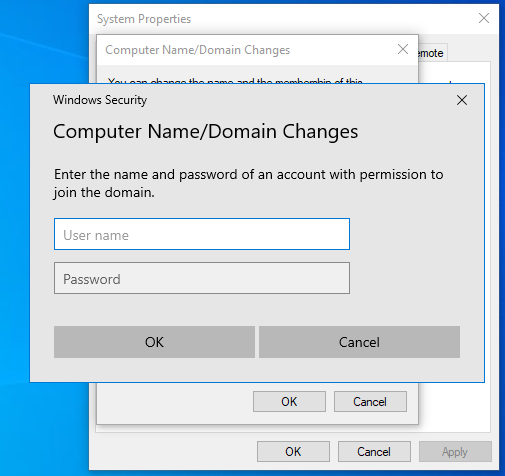
Log in with the Administrator account and password, and:
In a real-world environment, you would create users and put them into a custom group that is authorized to allow computers to join the domain.
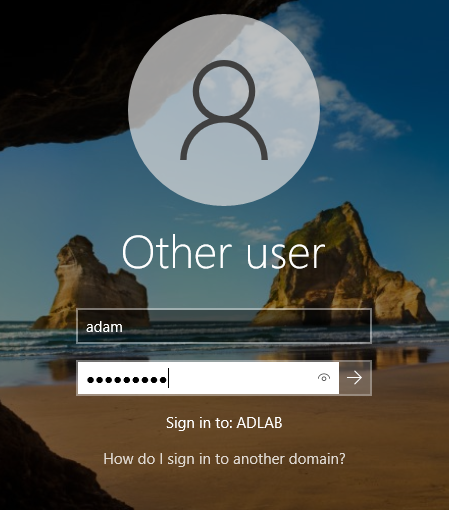
You will be prompted to restart the computer, and once we are on the log-on screen, we want to log in with the "Adam Smith" account. In order to do so, we want to click on the "Other user" and make sure that our "Sign in to" is pointing to our domain, and we see that it is "ADLAB", so we are good.
After you log in, you might see that some of the usual properties and sections are not accessible, like the PC name. This is because right now this PC belongs to the ADLAB domain, and there are rules in place.
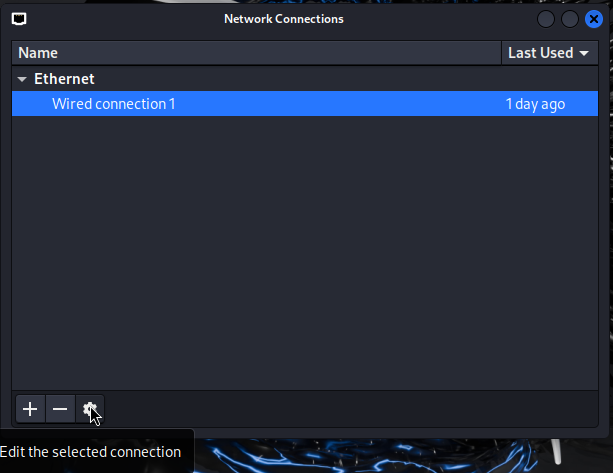
First, let's log in to our Kali Linux machine. By default, the Kali login and password are both Kali. After logging in, we need to set our IP address according to our diagram. To do this, right-click on the Internet icon on the top right of the desktop. Then click on the edit icon at the bottom after selecting the connection.
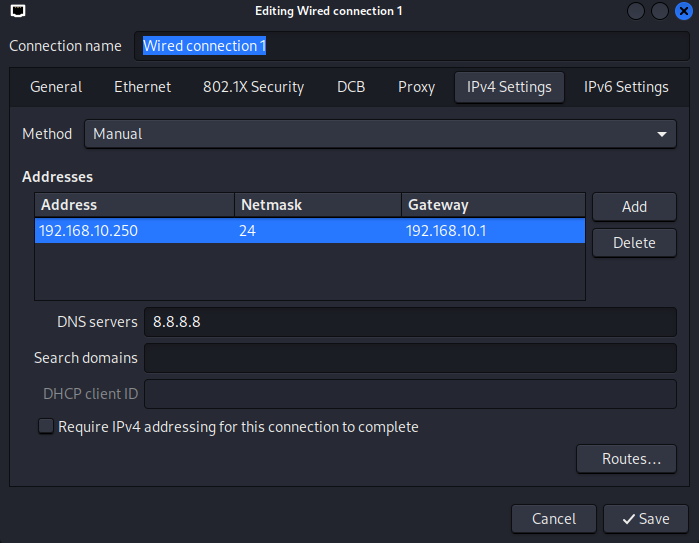
Here, just go to the "IPv4 Settings" tab and change the method from "Automatic (DHCP)" to "Manual". Then click on the "Add" button under the "Addresses" and enter the IP, netmask, and gateway with the DNS server IP, and click "Save".
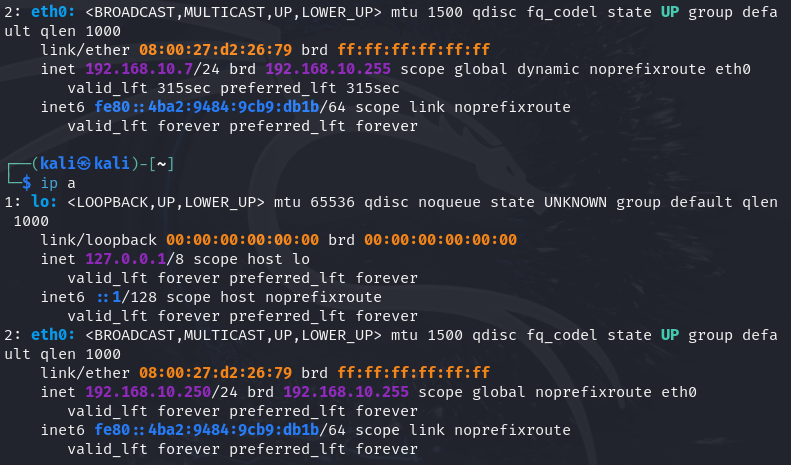
Next, let's open a terminal. You can open a terminal by right-clicking, or from the top left menu, also with the keybind Ctrl + Alt + T. And enter the ip a command to check the IP address to confirm.
If it has not changed to the one that we entered above, disconnect the internet and reconnect again from the top right menu by clicking the Internet icon and pressing "Disconnect". And we see that the IP is changed.
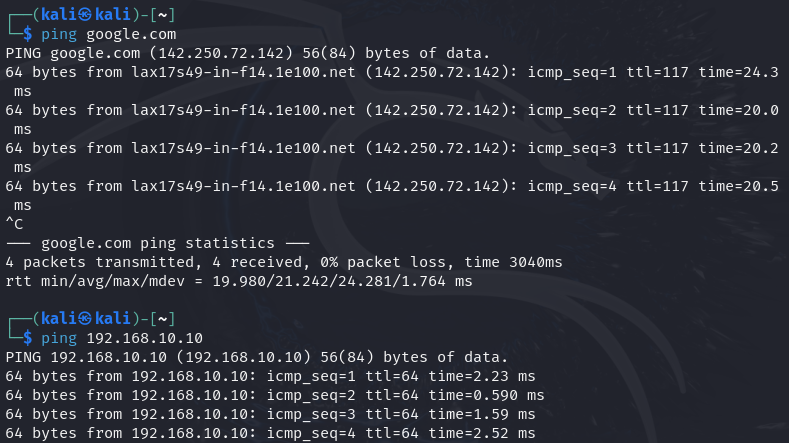
Also, ping google.com and the IP of the Splunk server to make sure that you have a connection.
Next, before going with any procedure, let's update and upgrade our Kali:
sudo apt-get update && sudo apt-get upgrade -y
After the updates have finished, we can start setting up our attack by first creating a new directory called "ad-lab". cd Desktop and mkdir ad-lab
And all of the files that we will create and use will be put into this directory.
For our attack today, we will be using a tool called crowbar.
sudo apt-get install -y crowbar
So this is the tool that we will use to perform brute force attacks, and we can target either the domain controller or our target machine. Disclaimer: Do not target any assets that you do not have permission to do so.
Now that our tool is installed, we can use the popular wordlist called "rockyou.txt" that comes with Kali Linux. You can find it under /usr/share/wordlists.
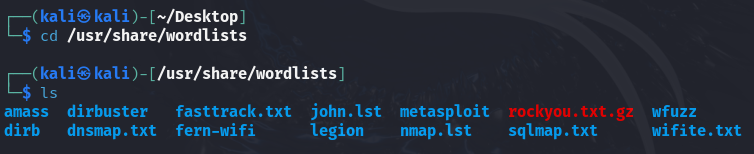
Let's unzip this file with sudo gunzip rockyou.txt.gz
And copy the wordlist to our "ad-lab" directory with cp rockyou.txt ~/Desktop/ad-lab
Now let's go to our "ad-lab" directory and check the "rockyou.txt" wordlist.
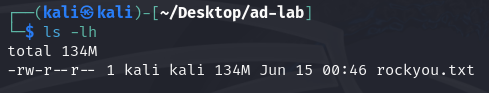
And its size is 134MB, which is very big, and for the purpose of this attack, we do not need this many passwords. So let's only get the first 20 lines.
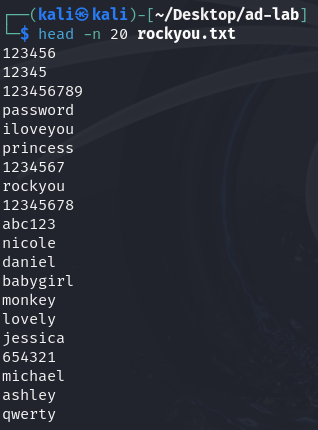
And if we use this command, it will copy these 20 lines into a new file:
head -n 20 rockyou.txt > passwords.txt
You can see the inside of this file by cat passwords.txt.
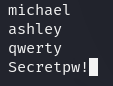
Now, as an attacker, you would probably do a lot of reconnaissance, probably set up some basic AD attacks, and let's just say in our scenario, we know we want to target a certain password, so that's what we will do with nano passwords.txt.
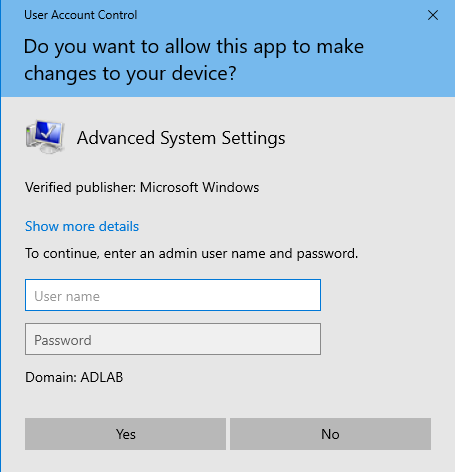
Now before we launch our attack, let's head over to our Windows target machine. On this machine, we want to enable Remote Desktop. And to do that, we want to search for "PC" and then "Properties" > "Advanced system settings". It will ask you for the admin username and password; enter them and continue. (This is the username and password for ADDC.)
On the opening page, select the "Remote" tab and then pick the Allow remote connections to this computer option. And then click on the Select Users button.
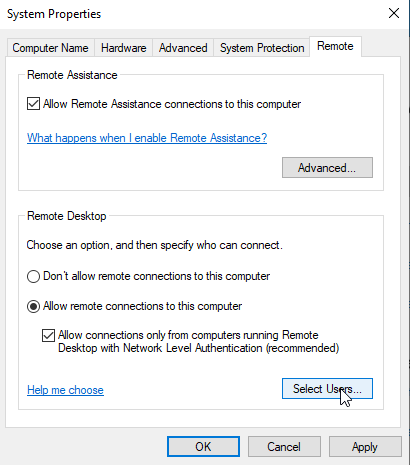
Here you can search for the names that are members of our AD group "adlab.local". Use the "Check Names" function to find them.
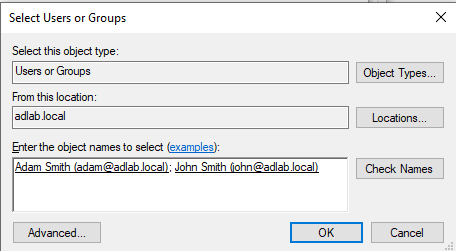
After selecting them, click "OK" and then "Apply". And now Remote Desktop for our target machine is enabled.
Let's head back to our Kali Linux machine. And to use our tool, we'll just type crowbar -h to see the help menu and to see what kind of options are available for us.
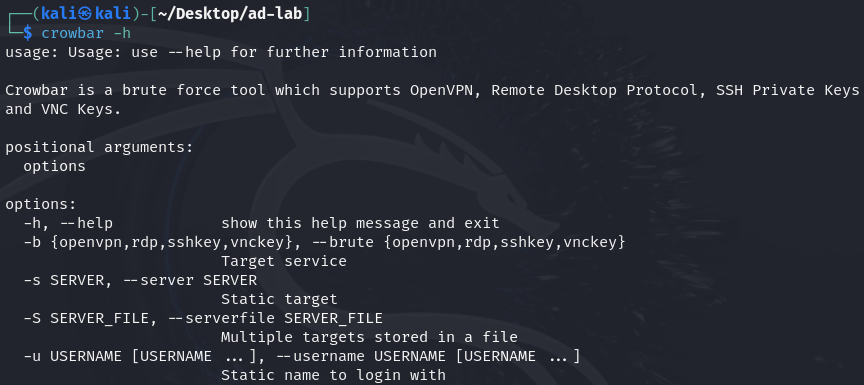
Crowbar is a brute force tool which supports OpenVPN, Remote Desktop Protocol, SSH Private Keys and VNC Keys.
The service that we are interested in is RDP; this is why we are using this tool and why we enabled RDP. The command that we will use with crowbar is the following:
crowbar -b rdp -u adam -C passwords.txt -s 192.168.10.5/32
Now to explain this command:
-b rdpis to select which service you want to use.-u adamis the username that we are targeting.-C passwords.txtis to specify the password list that we want to use.-sis to specify the IP, and we entered the target machine's IP./32is to specify that this is only 1 IP address.
Specifying the subnet mask or CIDR notation, especially in network configurations, helps avoid ambiguity and ensures that the intended network size and address range are clearly understood.
We enter and run the command:
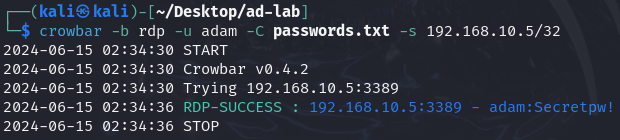
It actually starts and tries every password on the list. And from the result, we can see that we have an RDP success with the username "adam" and password "Secretpw!".
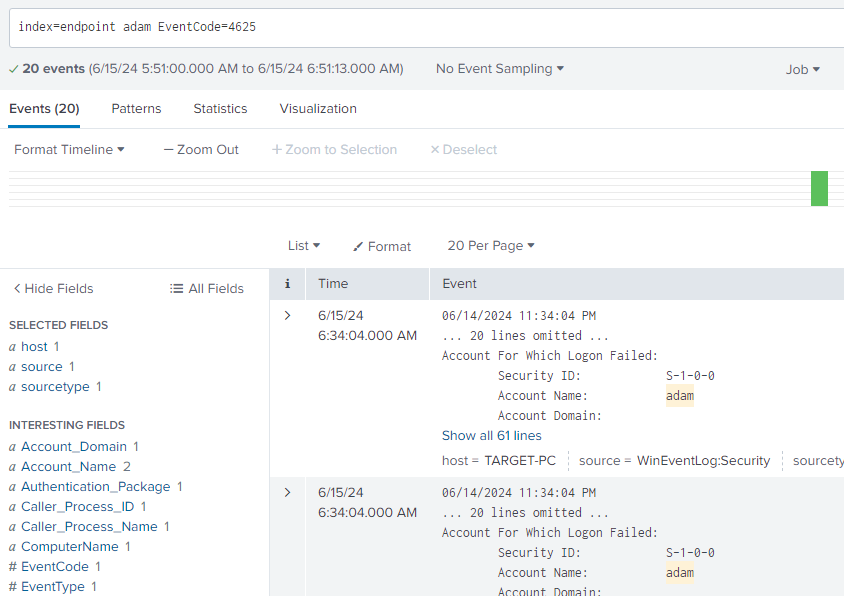
Now let's head over to Splunk and see what telemetry we had generated. In Splunk, go to "Search & Reporting". Because we know when the attack occurred, let's filter it out by the last 15 minutes. And also, we know the targeted user was "Adam Smith". By using these, let's narrow down our search.
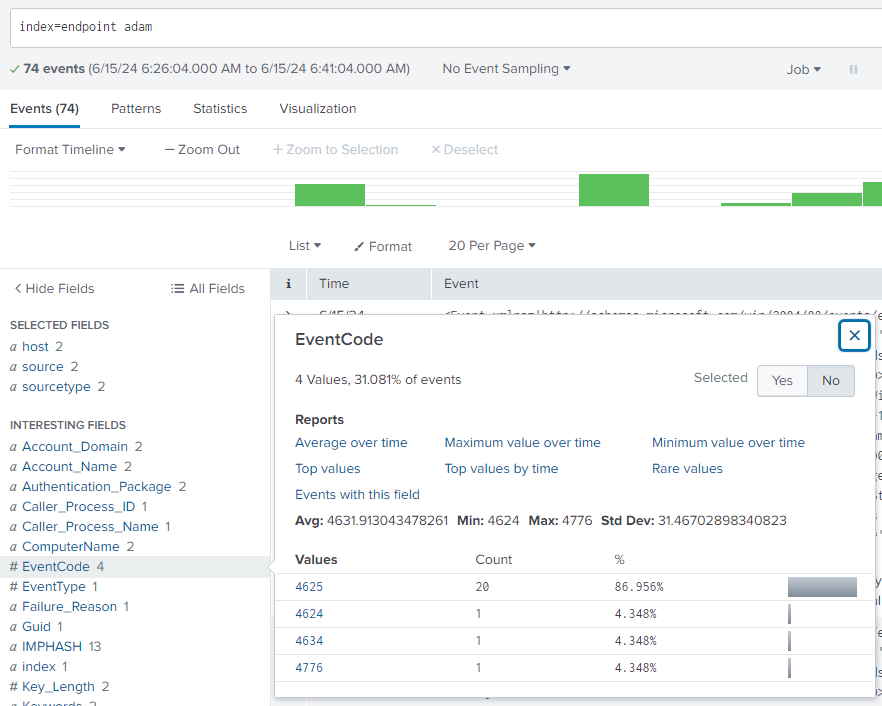
Now on the left side, we have interesting fields. And if we look at "# EventCode", we see that an event ID of 4625 occurred 20 times. Let's search this event ID to see what that is.
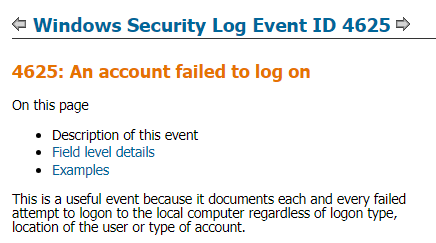
So this means that there were 20 failed attempts to log in to Adam's account, which is correct because if you recall, there was a total of 21 passwords in the "passwords.txt" file, of which 20 were incorrect. Let's filter down the EventCode 4625 by clicking on it.
Now when you see the times of these 20 events, you will see that all these events are happening pretty much at the same time, which can be a clear indication of brute force activity.
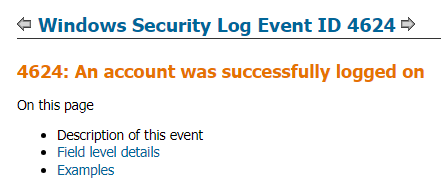
Now if we look at the EventCode 4624, you will see only one event.
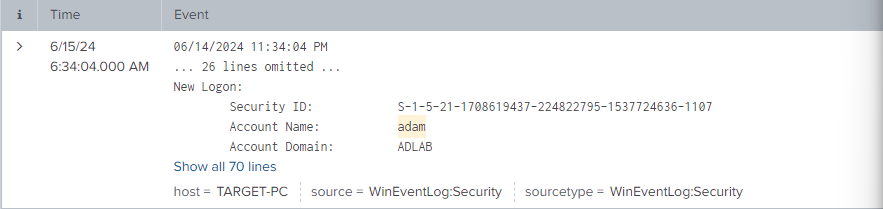
And when we search for the event of 4624, we see that it is a successfully logged-on event.
Now let's expand the log by clicking on "Show all 70 lines" and scroll down a bit.
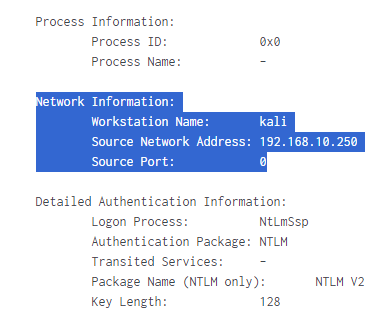
We do happen to see our workstation name as "Kali" and the IP address it is trying to log in from, and this does indeed belong to our Kali Linux machine.
Atomic Red Team is an open-source project that provides a library of small, discrete tests to simulate real-world attack techniques as defined by the MITRE ATT&CK framework. These tests help security teams evaluate and improve their detection and response capabilities by identifying gaps in their defenses. The tests are easy to use, well-documented, and can be tailored to fit various environments.
Now let's install Atomic Red Team on our target machine and run some tests on it.
Let's open a PowerShell with administrator privileges and then run the following command:
Set-ExecutionPolicy Bypass -Scope CurrentUser, then enter "Y" to confirm.
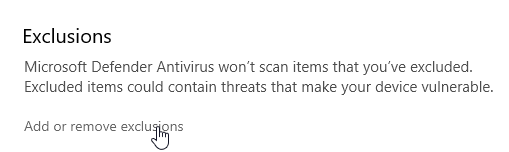
Now before installing Atomic Red Team on this PC, let's set an exclusion for the entire C drive because Microsoft Defender will detect and remove some of the files of Atomic Red Team.
Go to Windows Security > Virus & threat protection > Manage Settings > Exclusions.
Then click on the "Add an exclusion" button > "Folder" and select our C drive.
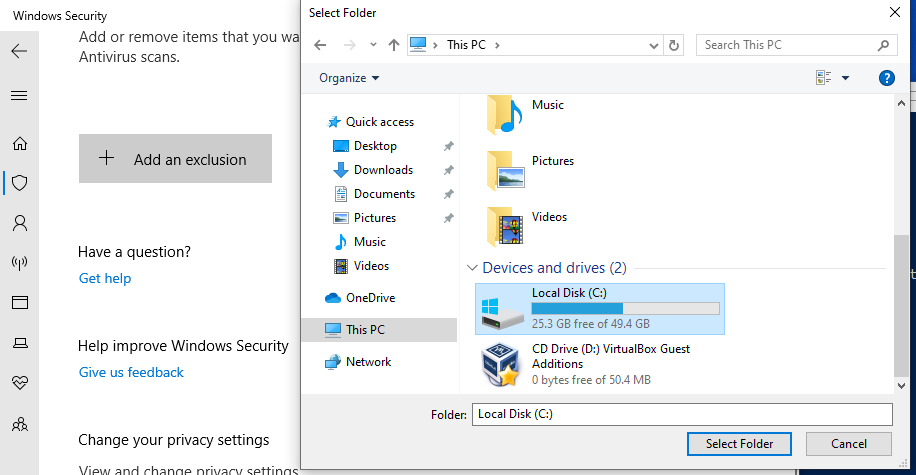
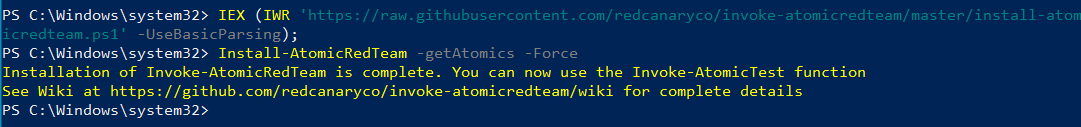
And you should be able to see "C:/" under the exclusions now. And we can now install Atomic Red Team by using these two commands:
IEX (IWR 'https://raw.githubusercontent.com/redcanaryco/invoke-atomicredteam/master/install-atomicredteam.ps1' -UseBasicParsing);
and then
Install-AtomicRedTeam -getAtomics
Enter "Y" when prompted.
After installation, go into the C drive, and inside the "AtomicRedTeam" directory, there is an "atomics" folder. Here we see a bunch of technique IDs, and these map back to the MITRE ATT&CK framework. When we go to MITRE ATT&CK®, all of these techniques have a unique ID.
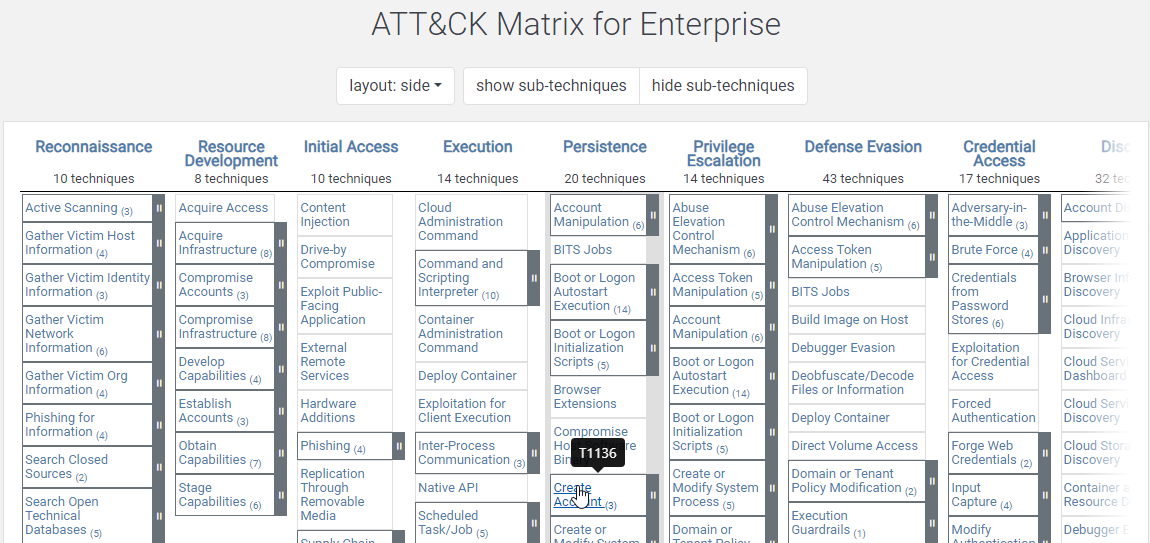
Let's say we want to test "T1136: Create Account" under the Persistence tab. And we see that we have 3 of them in our "atomics" folder.
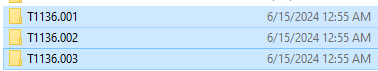
And when we check on the MITRE ATT&CK website, we see that 001 is for Local, 002 is for Domain, and 003 is for Cloud Account.
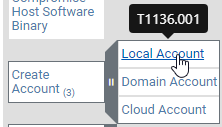
In this example, let's go ahead and use the first one, T1136.001.
To do this, we go back to PowerShell and write this command:
Invoke-AtomicTest T1136.001
and this will automatically generate telemetry based on creating a local account.
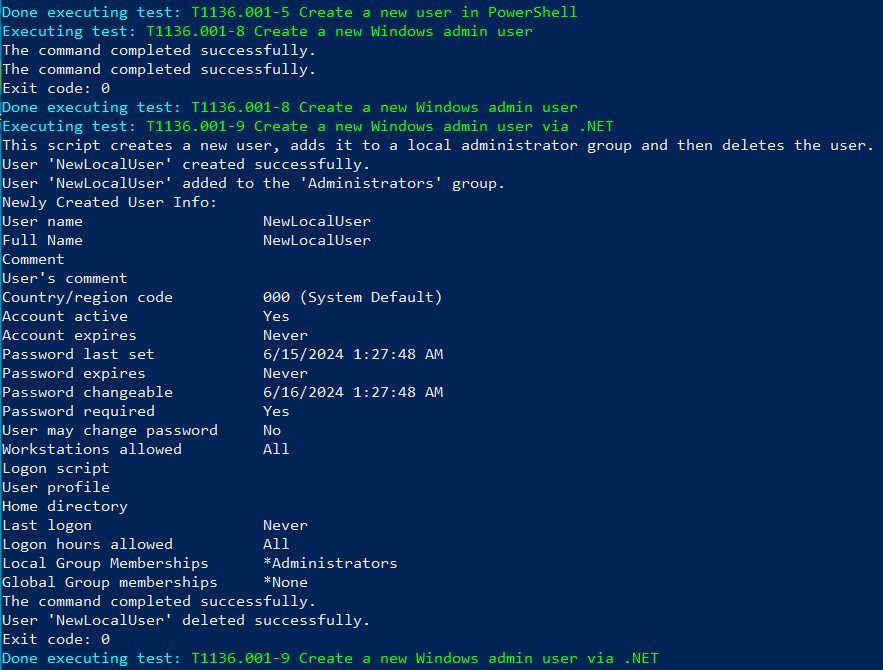
And now that our command has finished running, we can go and look into Splunk and search specifically for "new local user".
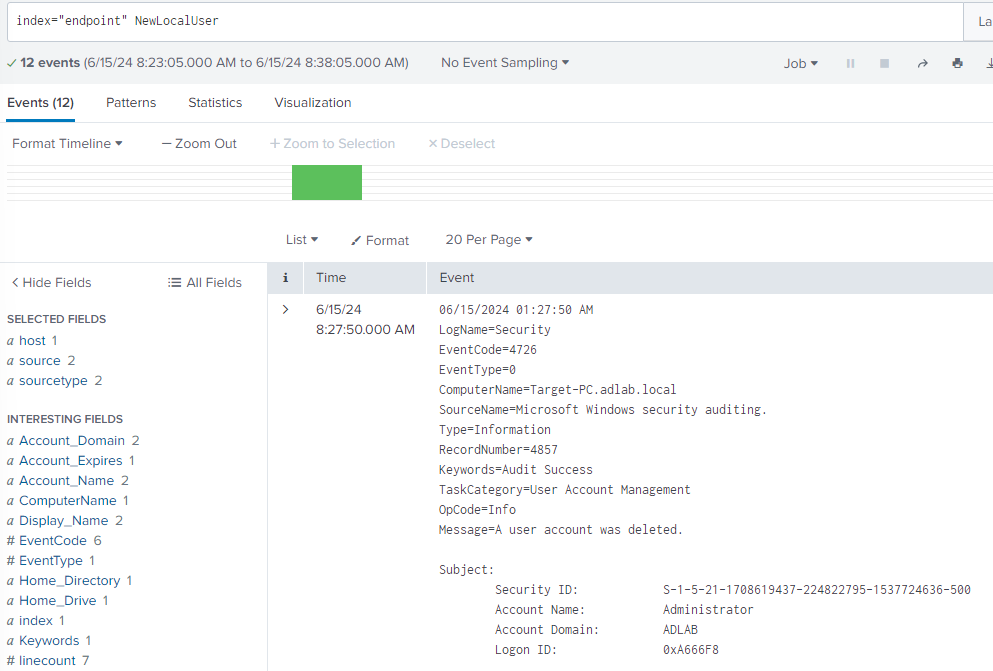
And we observed 12 raw events related to the activity. This confirms that our monitoring setup is capturing relevant data for this type of attack technique. The detailed logging will help us analyze and improve our detection and response capabilities.
Let's try another one, "T1059: Command and Scripting Interpreter".
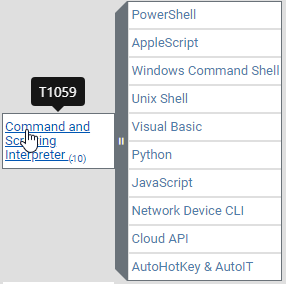
Let's go with PowerShell, which is T1059.001.
Running this code, Defender catches a couple of things, and let's see what is going on with Splunk.
Run the search with index=endpoint powershell, and we see that 523 events occurred in the last 15 minutes.
And for example, when we check this event:
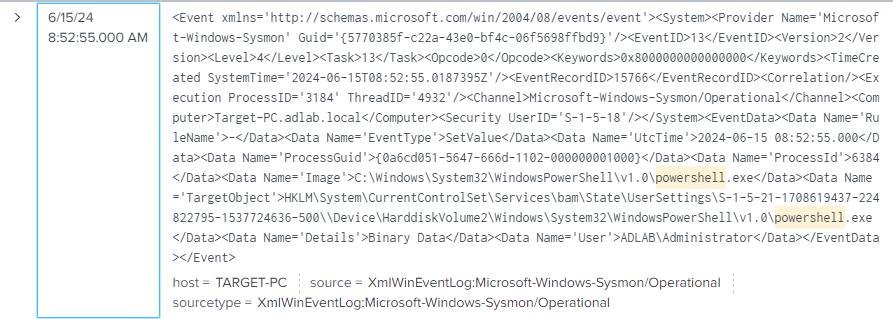
We actually see that this event indicates that the PowerShell executable (powershell.exe) running under the ADLAB\Administrator account modified a registry value. Specifically, the registry key HKLM\System\CurrentControlSet\Services\bam\State\UserSettings was altered. The bam registry key typically relates to the Background Activity Moderator, which Windows uses to manage app background activity.
The event captured shows the simulated attack test (T1059.001) modifying a registry value using PowerShell. It indicates that our Sysmon configuration is capturing relevant events, which is crucial for detecting and responding to such activities. Review the surrounding events for a complete picture and ensure your detection mechanisms in Splunk are tuned to catch and alert on such activities.
In this project, we set up an Active Directory environment, installed and configured Splunk to ingest logs from our Windows machines, performed a brute force attack using Kali Linux, and tested our detection capabilities using Atomic Red Team.
Key takeaways:
- Setting up an Active Directory environment allows us to understand how user and computer management works in an enterprise setting.
- Splunk is a powerful tool for collecting, indexing, and analyzing machine-generated data, which is essential for security monitoring and incident response.
- Brute force attacks are a common threat, and it's crucial to have mechanisms in place to detect and prevent them.
- Atomic Red Team provides a practical way to test our detection and response capabilities against real-world attack techniques.
- Continuous monitoring, tuning, and improvement of our security controls are necessary to stay ahead of evolving threats.
By going through this project, we have gained hands-on experience in setting up and securing an Active Directory environment, as well as leveraging Splunk for security monitoring. This knowledge will be valuable in real-world scenarios where securing and monitoring Windows environments is critical.