

Spectroscopy techniques such as Raman Spectroscopy and Photoluminescence (PL) are widely used in various fields, including materials science, chemistry, biology, and geology. In recent years, these techniques have increasingly found their place in cleanroom environments, particularly within the microelectronics industry, where they serve as critical metrology tools for wafer-scale measurements. The data collected from these in-line measurements (wafer data) require specific processing, but existing software solutions are often not optimized for this type of data and typically lack advanced plotting and visualization capabilities. Additionally, the licensing requirements of these software solutions can restrict access for a broader community of users.
SPECTROview addresses these gap by offering free, open-source software designed to enhance both data processing and visualization workflows. Optimized for handling wafer-type data as well as standard spectroscopic data, SPECTROview enables users to streamline not only data processing but also visualization, making the process more efficient and faster.
- Cross-platform compatibility (Windows, macOS, Linux).
- Optimized user inferface for easy and quick inspection and comparison of spectra.
- Supports processing of spectral data (1D) and hyperspectral data (2D maps or wafer maps)*.
- Ability to fit multiple spectra or 2Dmaps using predefined models or by creating custom fit models*.
- Collect all best-fit results with one click.
- Dedicated module for effortless, fast, and easy data visualization.
*Fitting features are powered by the fitspy and LMfit open-source packages.
(Fitting multiple spectra / wafers / 2D-maps with predefined models)
(Collect data with one click)
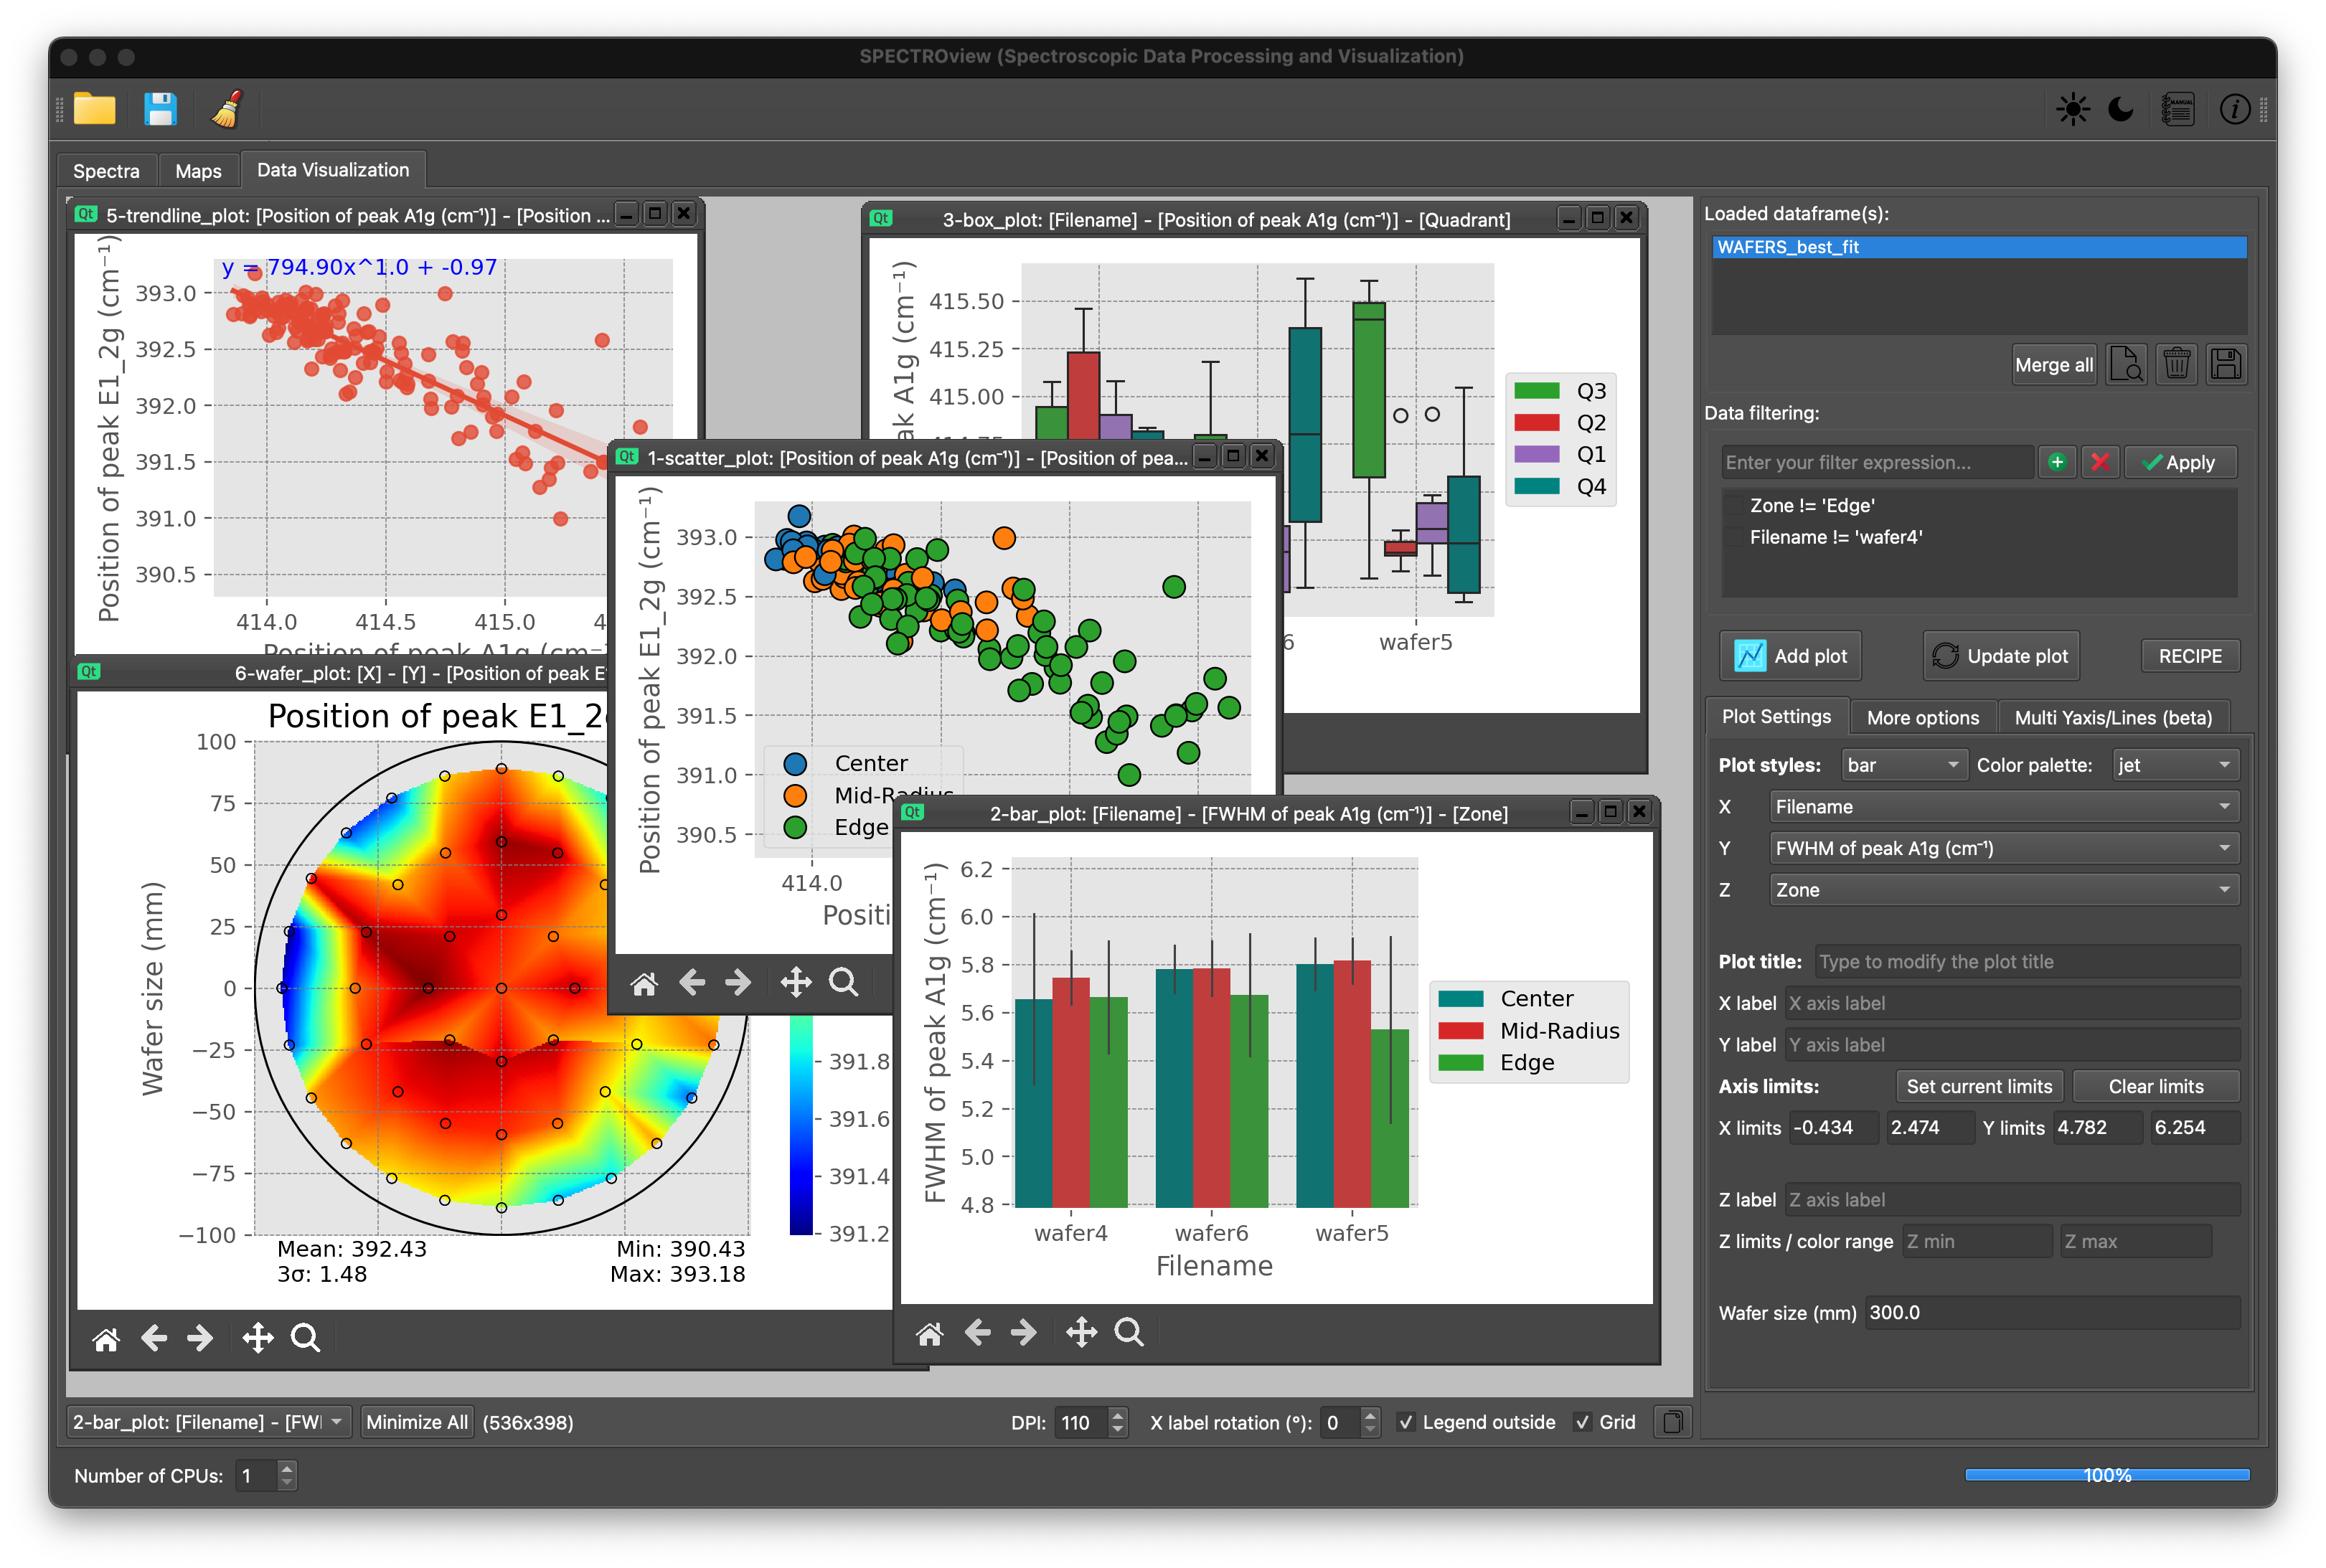
(Support various plotting styles with automatic statistical calculations)
Ensure that Python is already installed on your computer.
pip install spectroviewpip install git+https://github.com/CEA-MetroCarac/SPECTROview.gitspectroviewThis work, carried out on the CEA - Platform for Nanocharacterisation (PFNC), was supported by the “Recherche Technologique de Base” program of the French National Research Agency (ANR).
For any feedback, contact: van-hoan.le@cea.fr